Conditional Formatting
Atlas Charts provides conditional formatting options which modify the styling of individual chart values based on conditions you define. Conditional formatting is available for Table and Number charts.
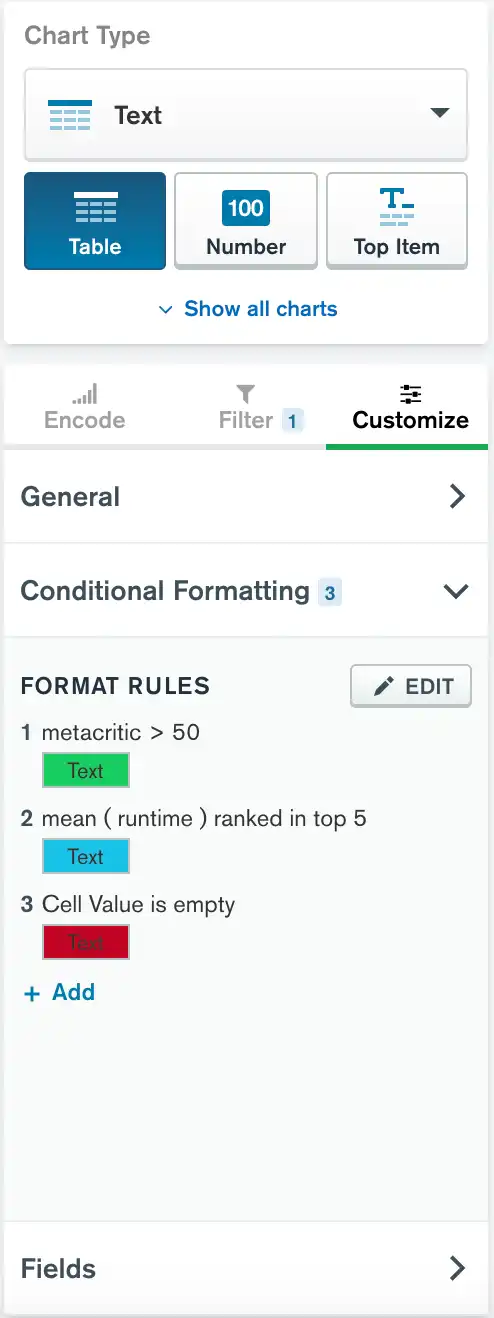
To view your existing rules or to add, edit, or delete a rule, expand the Conditional Formatting section of the Customize tab.

Applying Multiple Rules
Multiple conditional formatting rules can affect the styling of the same value.
Conditional formatting rules take precedence in the order you put
them in. Rule 1 overwrites rule 2 in cases where both
rules affect the same styling of a value.
Example
The following conditional formatting rules both apply to a value:
White text
Black text, green background
The value's text is white because rule 1 takes precedence. The
background is green because both rules apply.
Use Case
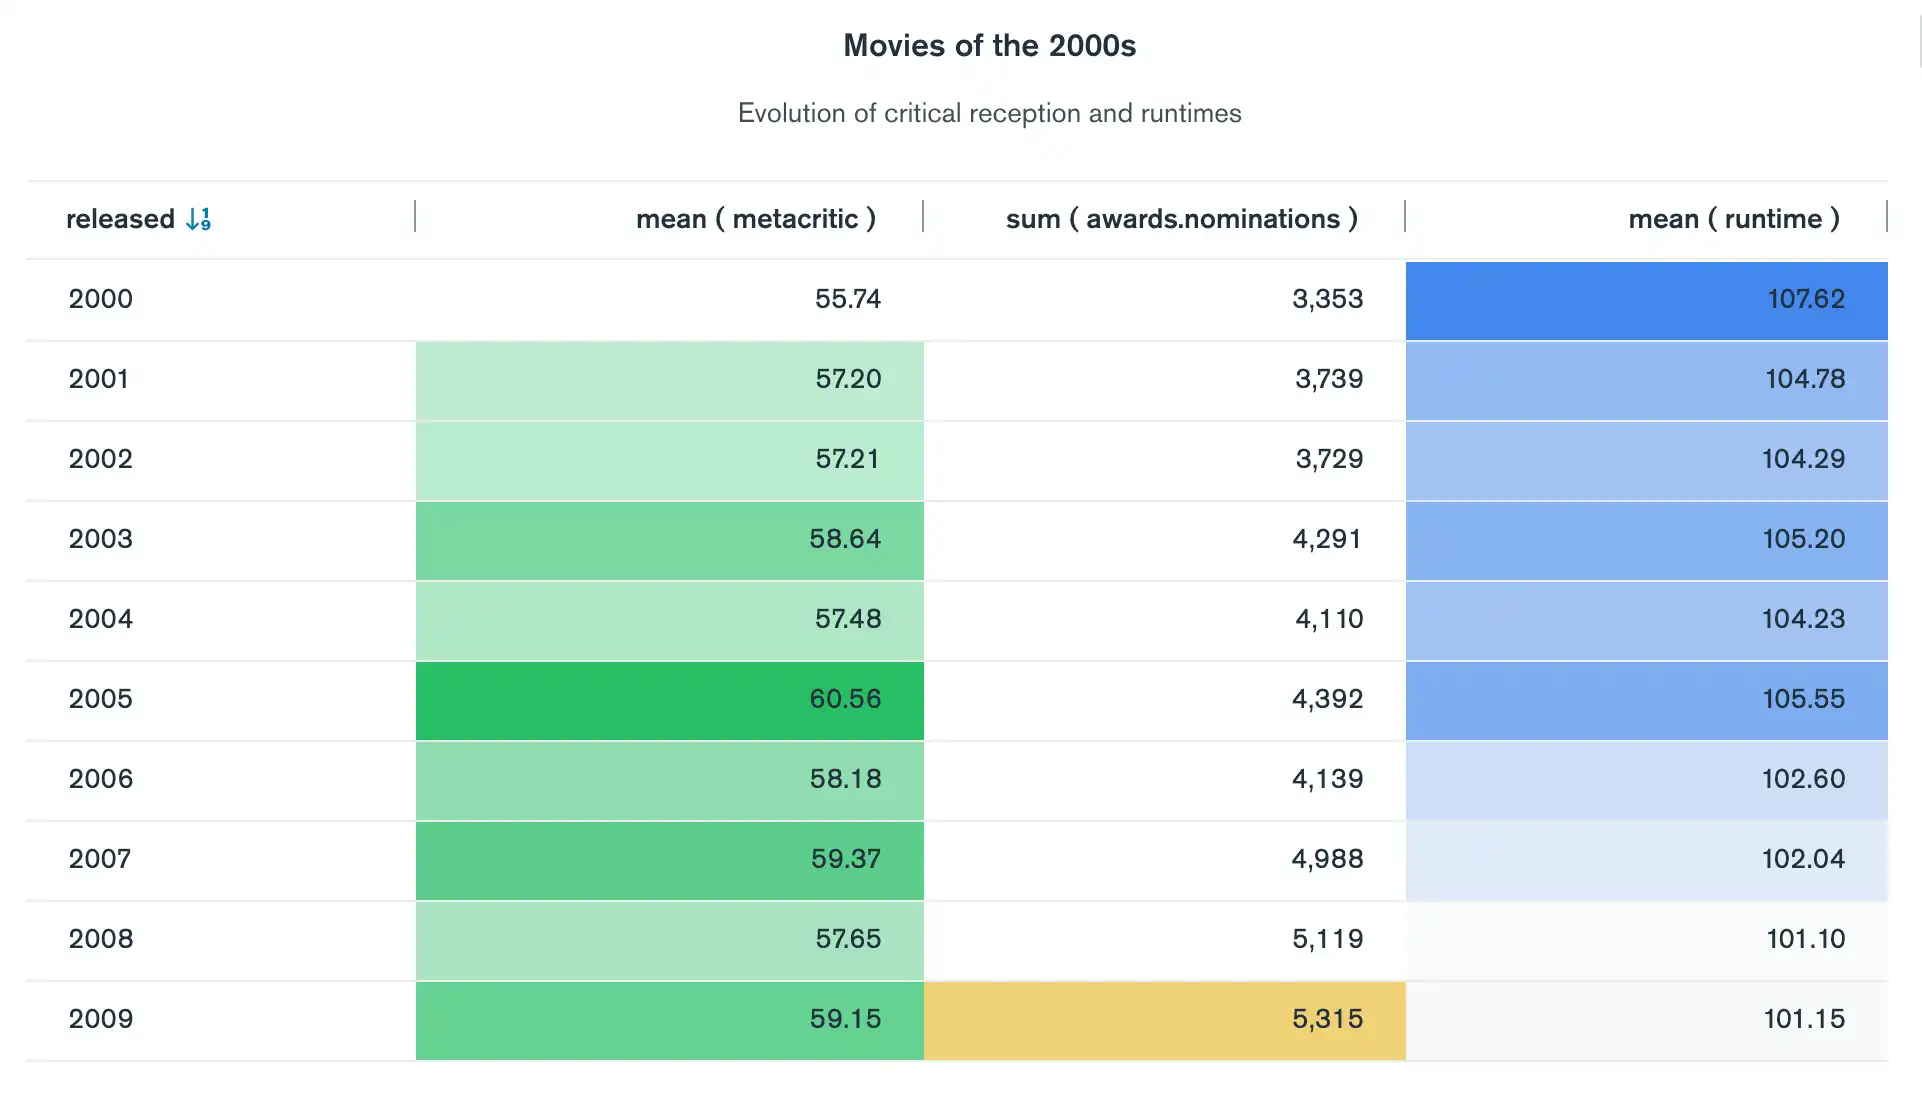
Conditional formatting can help clarify the insights that your chart provides. The following example uses conditional formatting to highlight slight shifts in critical reception and runtime in movies of the 2000s.

Add a Rule
To add a conditional formatting rule:
Navigate to the Customize tab in the Chart Builder.
Select Single Color or Color Scale.
Single Color sets styling options for values in a field that match specific conditions.
Color Scale applies a color gradient to the entire range of values in a field, with the minimum value colored by one end of the gradient and the maximum value colored by the opposite end of the gradient.
Configure conditions.
To configure a condition for Single Color format rules:
From the Applies to dropdown menu, select a field or an aspect of your chart to which you want to apply a condition.
From the Operator dropdown menu, select a condition. Depending on the type of field you selected, you can choose from numeric, string or date operators.
From the Input dropdown menu, specify a value to which to compare field values using the operator you selected.
Note
For more information on condition configuration options, see Conditions Reference.
You can add any number of conditions to a rule. To add another condition, click Another. A value must match all conditions for the rule to apply.
To configure a Color Scale format rule, select a field to which you want to apply a color gradient from the Applies to dropdown menu. The color gradient applies to values in that field.
Customize the styling of values that match your condition.
To customize the styling for Single Color format rules, use the editor under Styling. You can apply basic text styling and change the color of value backgrounds and text.
On a table chart, to apply that formatting to an entire row, select Format entire row.
For Color Scale format rules, click the color gradient under Styling to select a predefined color range. Click the arrow icon to the right of the color gradient to invert the gradient.
Reorder, Edit, or Delete a Rule
To reorder, edit, or delete conditional formatting rules:
Navigate to the Customize tab in the Chart Builder.
Reorder, edit, or delete a rule.
To reorder a rule, drag it to your desired rank. Conditional formatting rules take precedence in the order that you put them in. Atlas Charts saves the order of your rules automatically.
To edit a rule, click the icon on that rule. When you are finished editing, click Save. To abandon your changes, click Cancel.
To delete a rule, click the icon on that rule. Atlas Charts deletes the rule immediately.