You can create a single-series chart that contains multiple aggregated values. These aggregated values can be from either the same field or different fields in your data source. Use this functionality to visualize multiple aggregated values without grouping your data into categories.
Supported Chart Types
You can include multiple aggregations in your single-series chart on the following chart types:
Grouped and Stacked Bar Charts
Grouped and Stacked Column Charts
Discrete Line Charts
Discrete Area Charts
Procedure
To create a single-series chart that contains multiple aggregated values:
Behavior
When you encode multiple aggregation fields, the Series encoding channel is disabled.
When you create a single-series chart with only aggregated values, each aggregated value is treated as its own category. If you encode a Category field in addition to your aggregation fields, the aggregated values become series (instead of categories). To learn more, see Map Multiple Fields to a Single Axis.
Example
The following chart uses the Sample Data: Movies data source to show the mean IMDB and Rotten Tomatoes ratings across all movies.
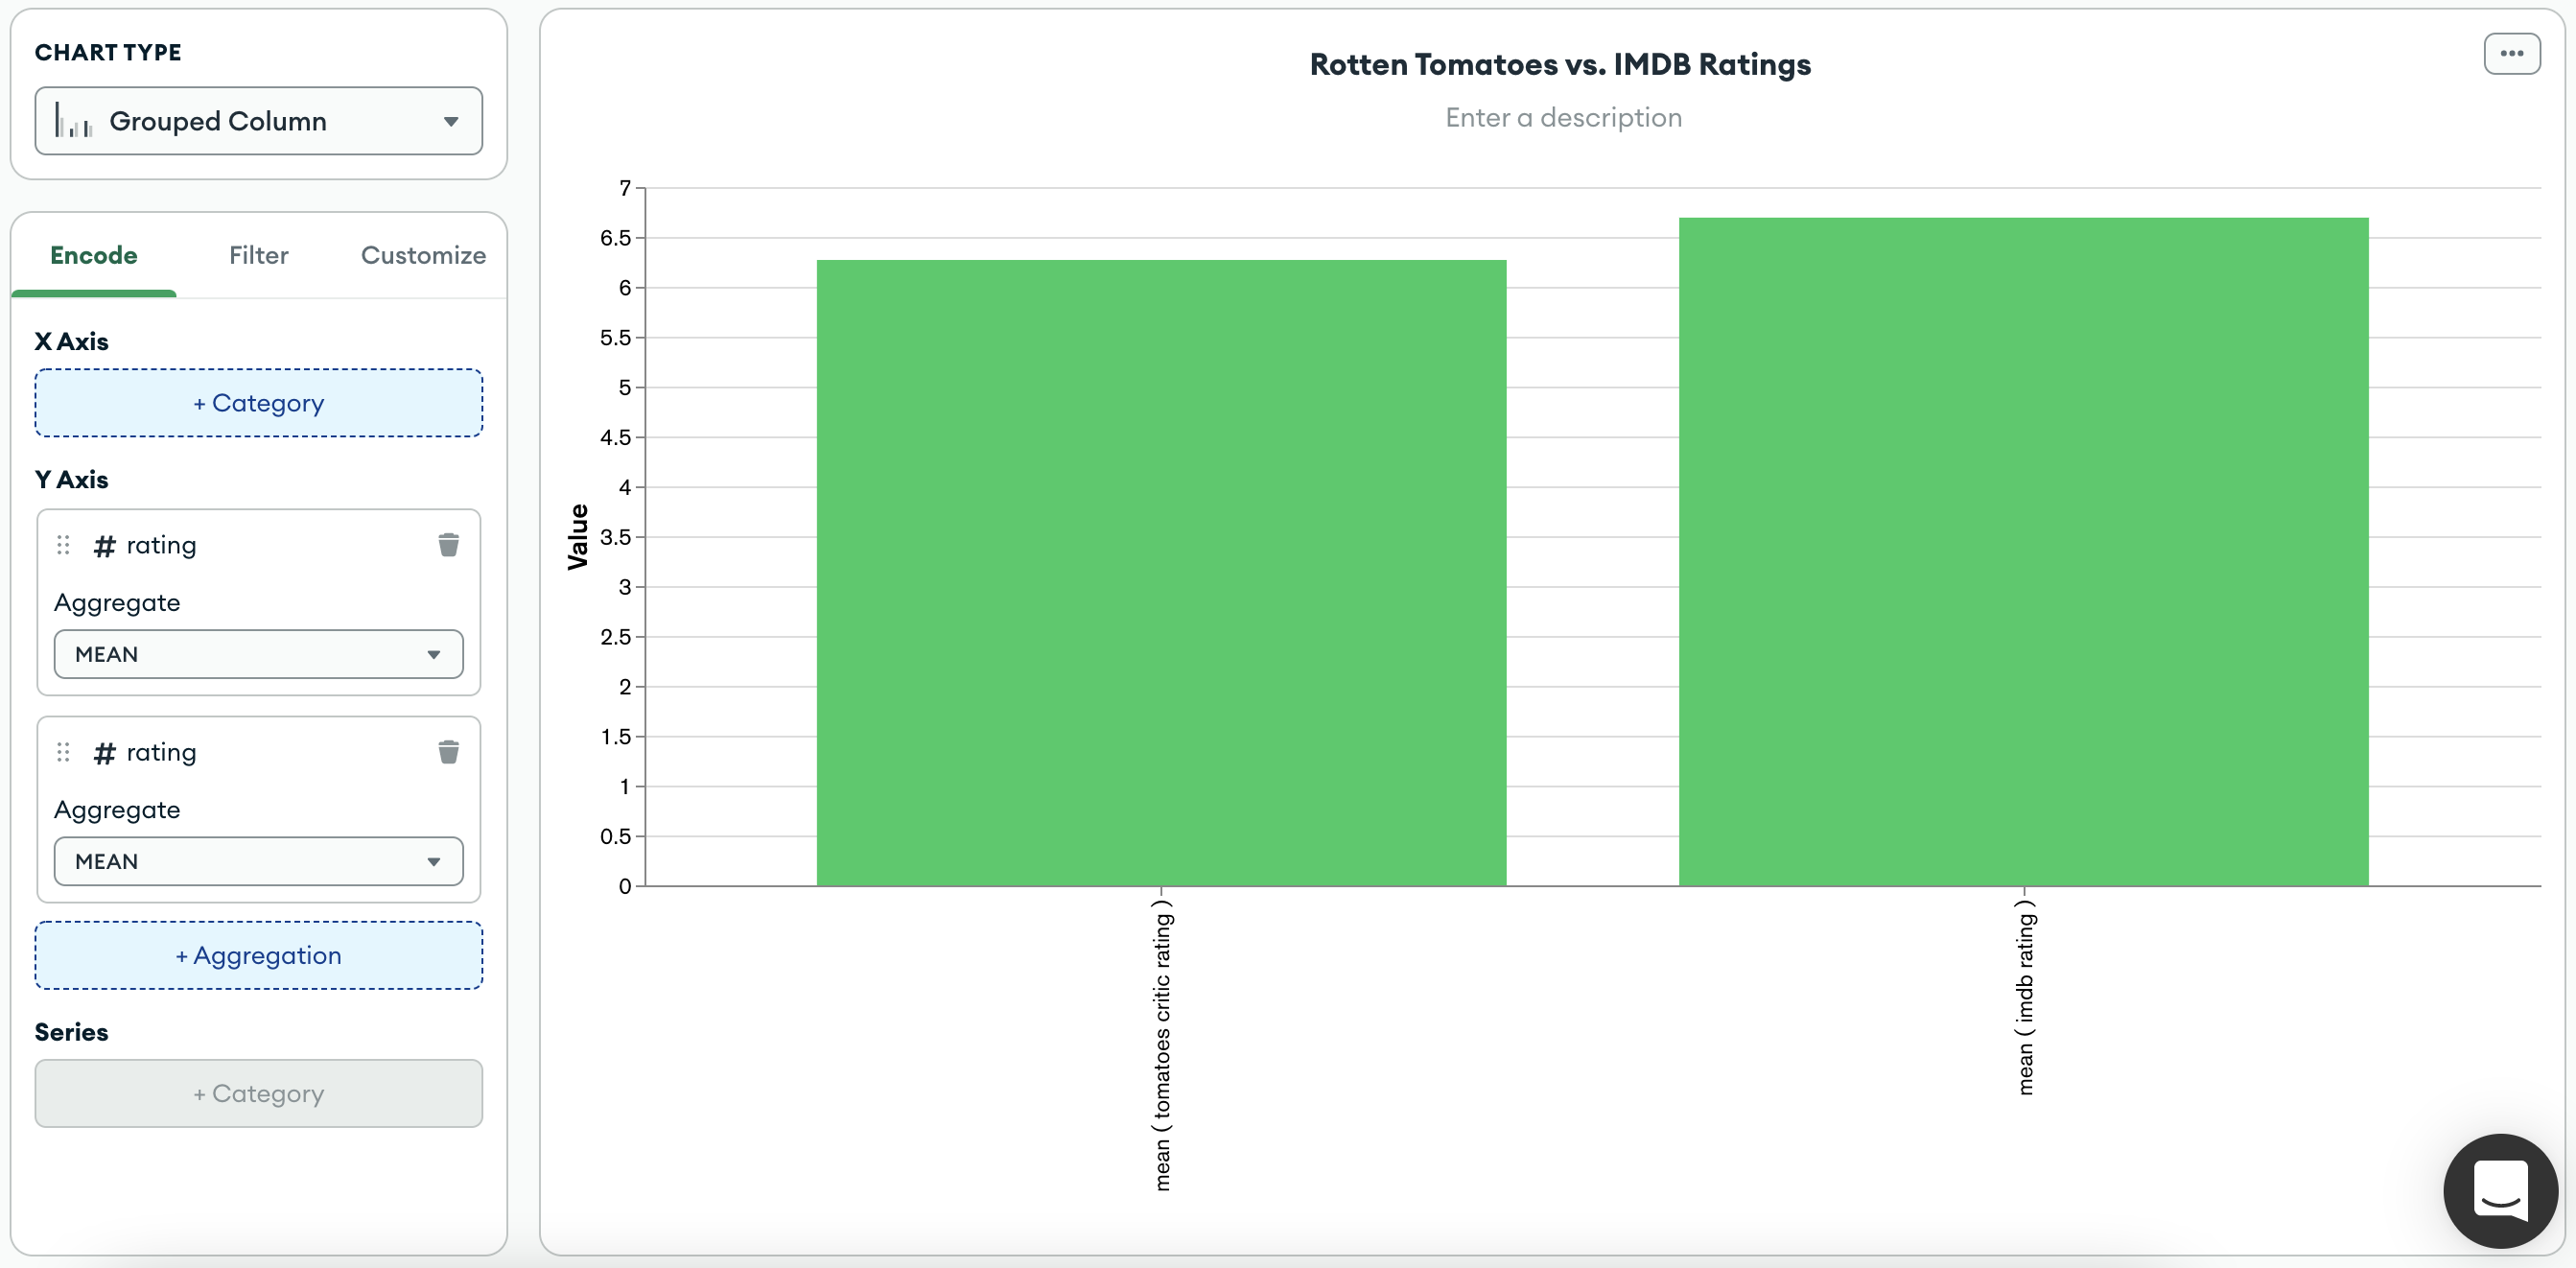
The chart contains two aggregation encoding channels:
Mean
imdb.ratingMean
tomatoes.rating
Since no field is applied to the category encoding channel, the chart shows the mean ratings across all movies, irrespective of any categorical grouping.