Docs Menu

Docs HomeMongoDB Charts

Dashboards

On this page

  • Dashboards Page
  • Create a New Dashboard
  • Add a Sample Dashboard
  • Add a Billing Dashboard
  • Refresh Dashboard Data
  • View Chart Data
  • Export and Import a Dashboard
  • Fullscreen Dashboard View

Dashboards are a collection of charts assembled to create a single unified display of your data. Each chart shows data from a single MongoDB collection or view, so dashboards are essential to attain insight into multiple focal points of your data in a single display. Dashboards can be shared with other users.

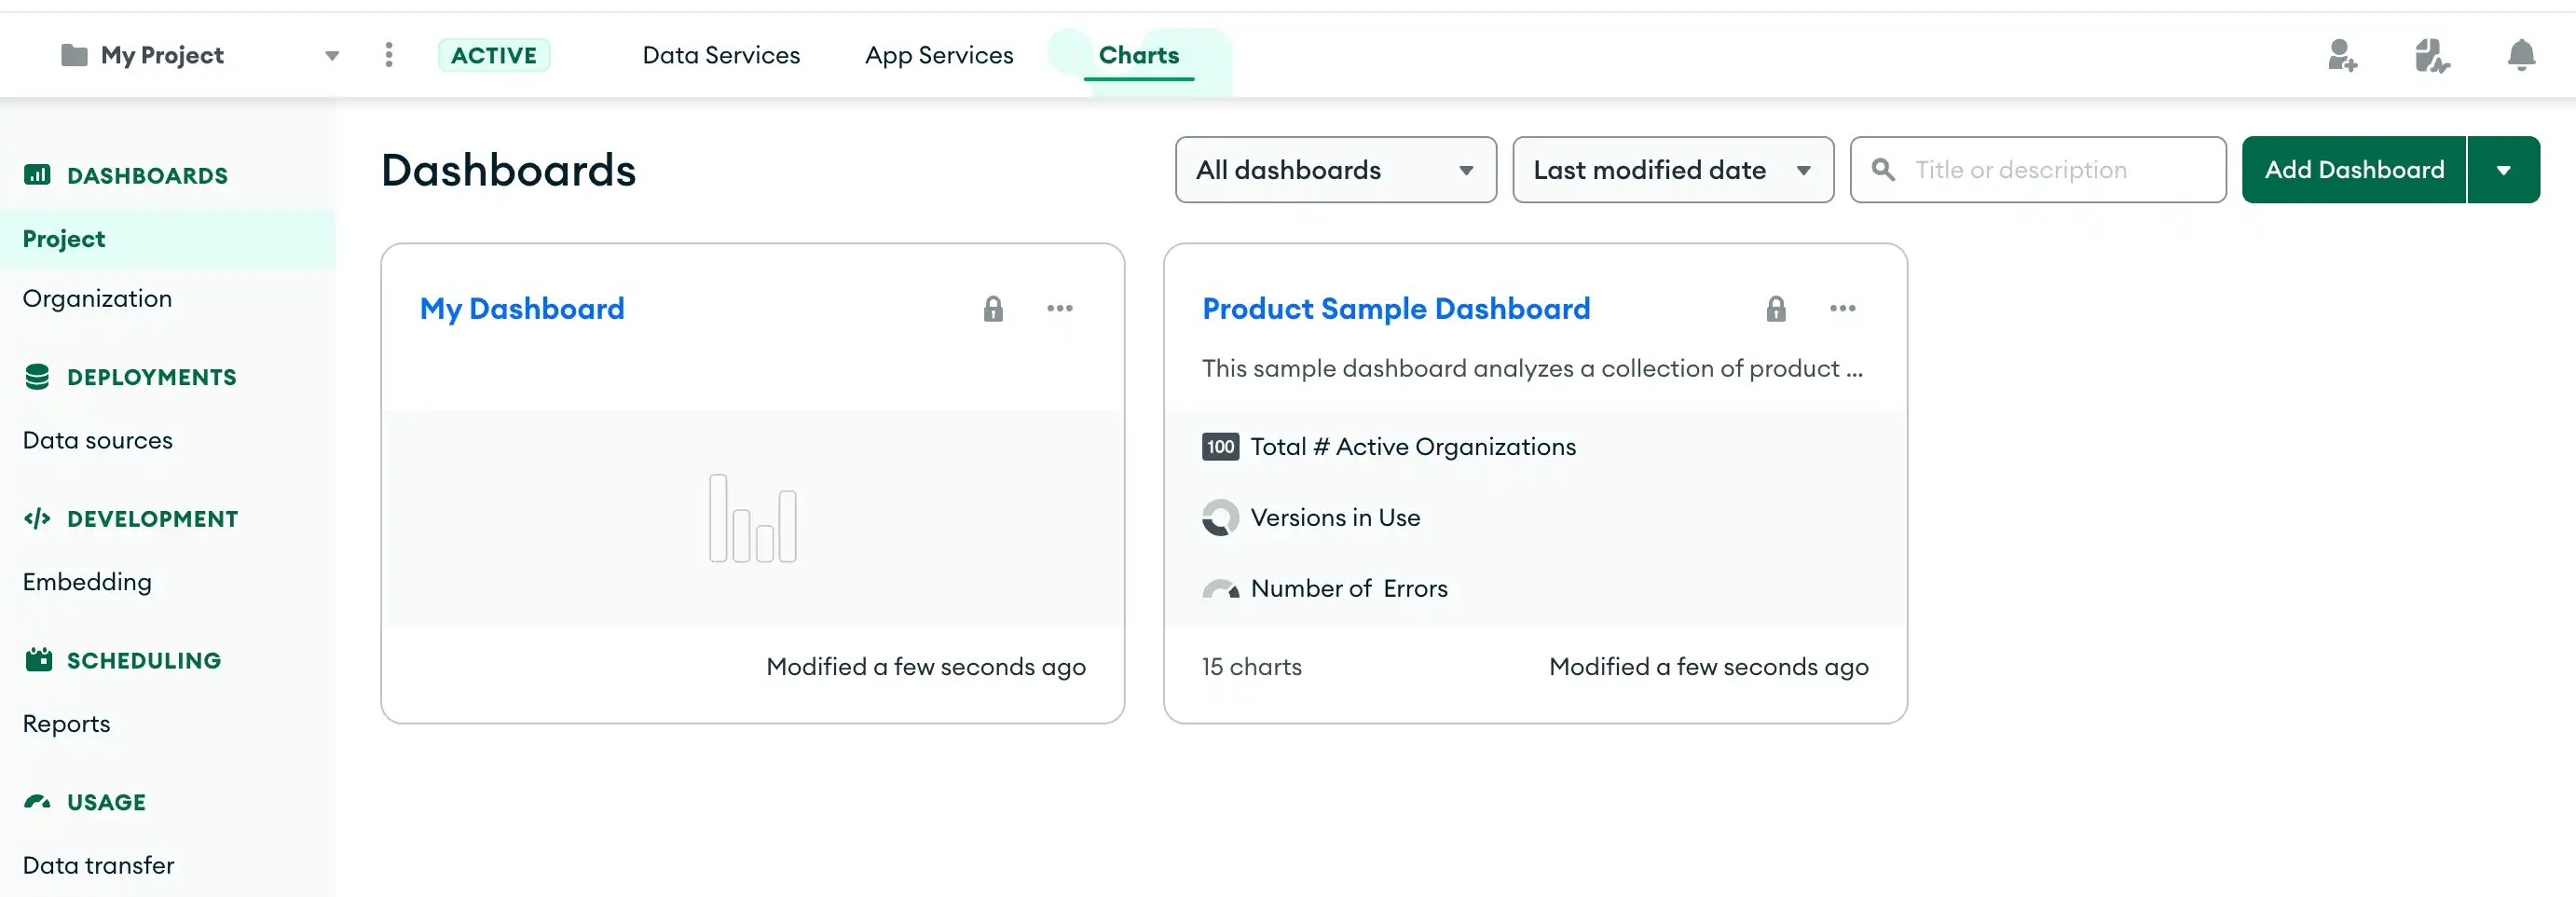
The Dashboards page shows all dashboards you have access to view. To get to your project's Dashboards page, click Charts in the Atlas navigation bar.

To learn more about dashboard permissions in MongoDB Charts, see Dashboard Permissions.

Charts Dashboard Tab

Each dashboard shows the following information:

  • Title

  • Description

  • A preview of the first three charts in the dashboard, including the chart title and type

  • When the dashboard was last modified

By default, the most recently modified dashboards are shown first in the list. You can change the sort order by using the Sort By dropdown menu.

To create a new dashboard:

1

From the Dashboards page, click Add Dashboard.

2

In the Add Dashboard dialog, enter a Title for your dashboard. Optionally, enter a Description.

3

Click Save.

Charts opens your newly created dashboard and prompts you to add the first chart to your dashboard:
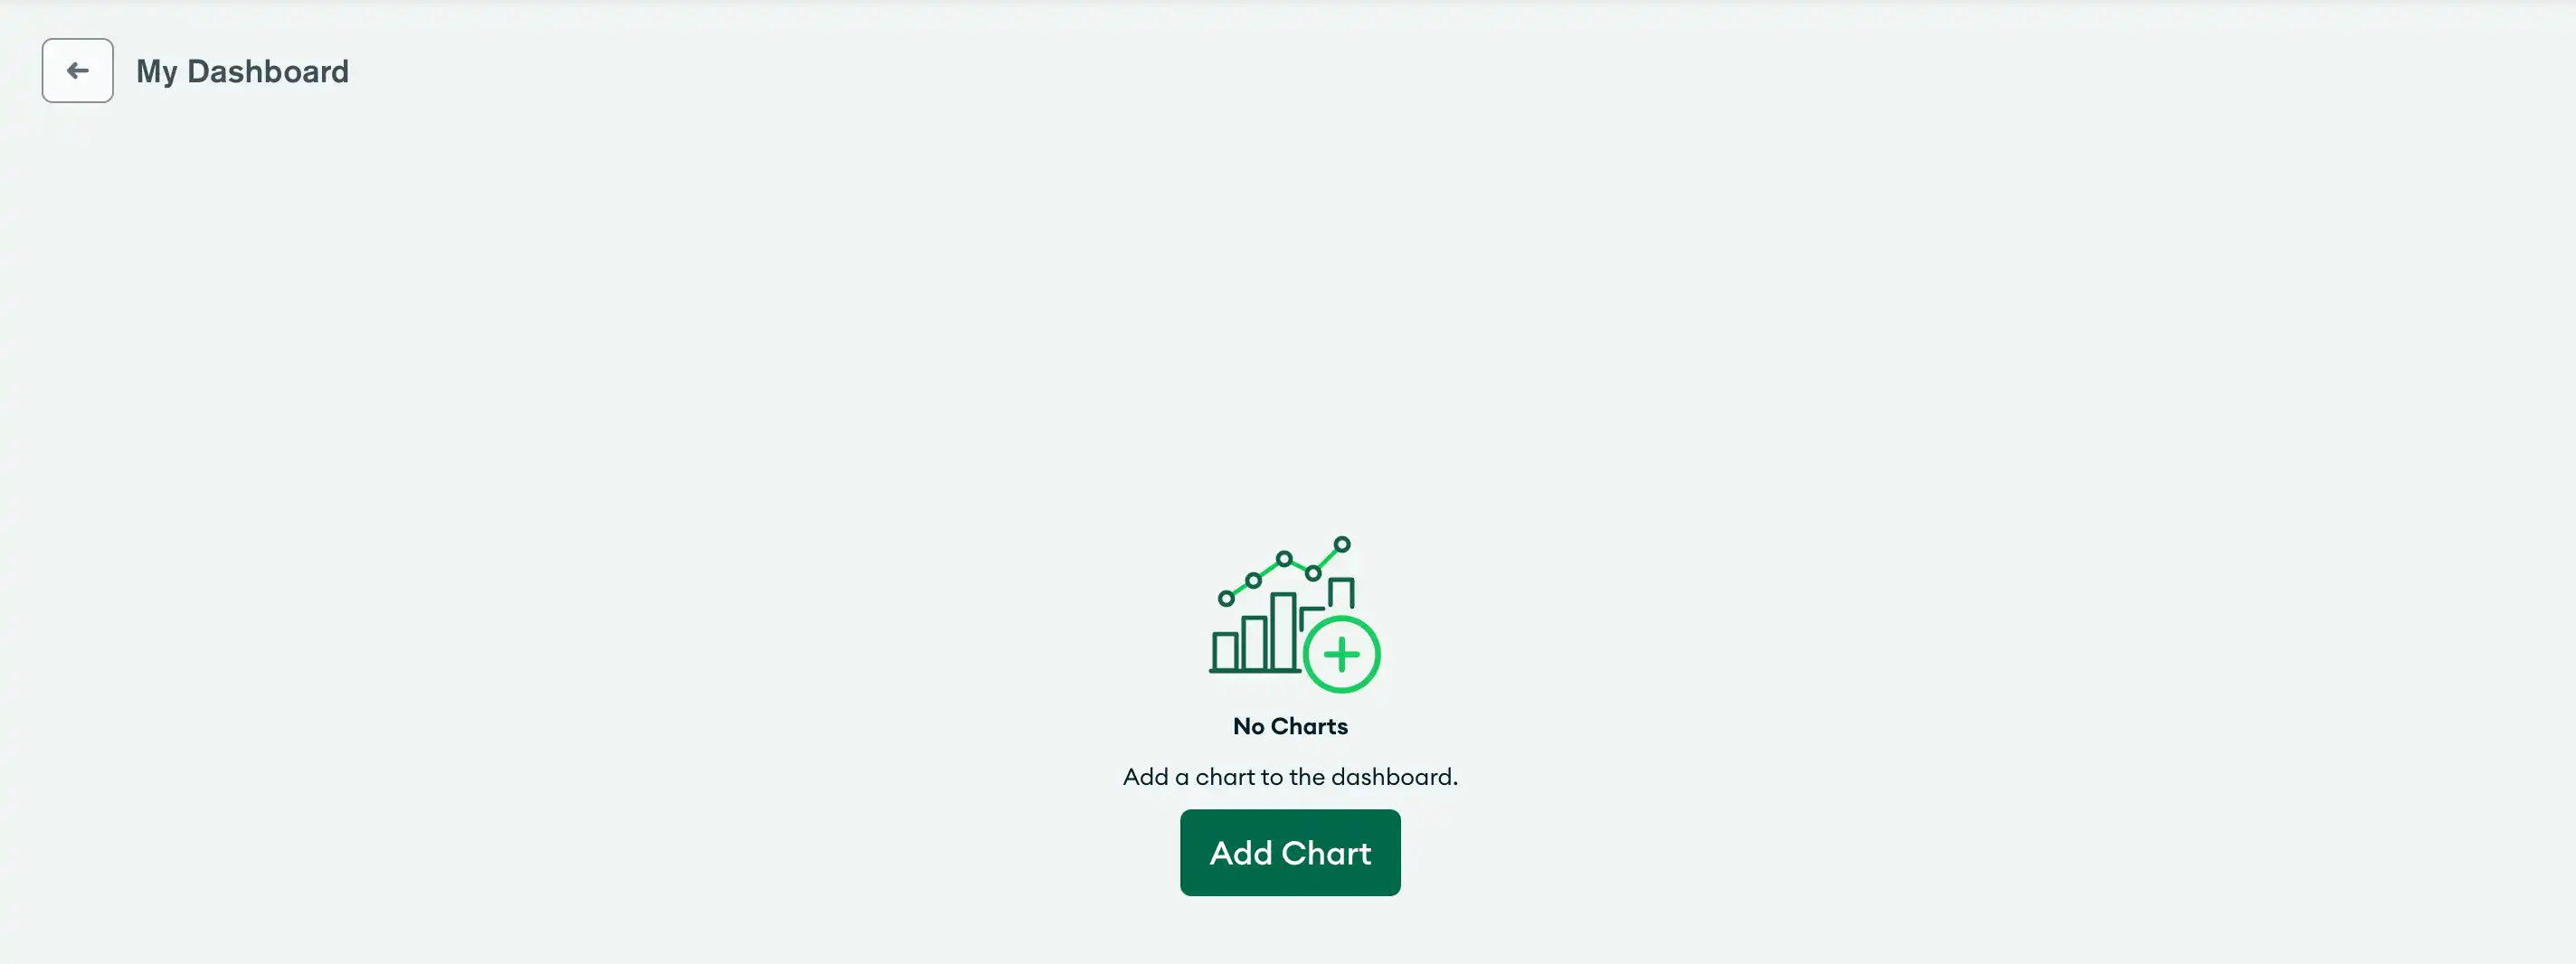
Charts New Dashboard Example

MongoDB Charts provides several sample dashboards that use various sample data sources. You can add a sample dashboard to explore different examples of charts you can create.

Tip

You can add a new sample dashboard even if you have an existing sample dashboard in your Charts project. This can be useful if you have changed a sample dashboard and want a fresh copy.

To add a sample dashboard:

1

From the Dashboards page, expand the Add Dashboard dropdown menu and select Add sample dashboard.

2

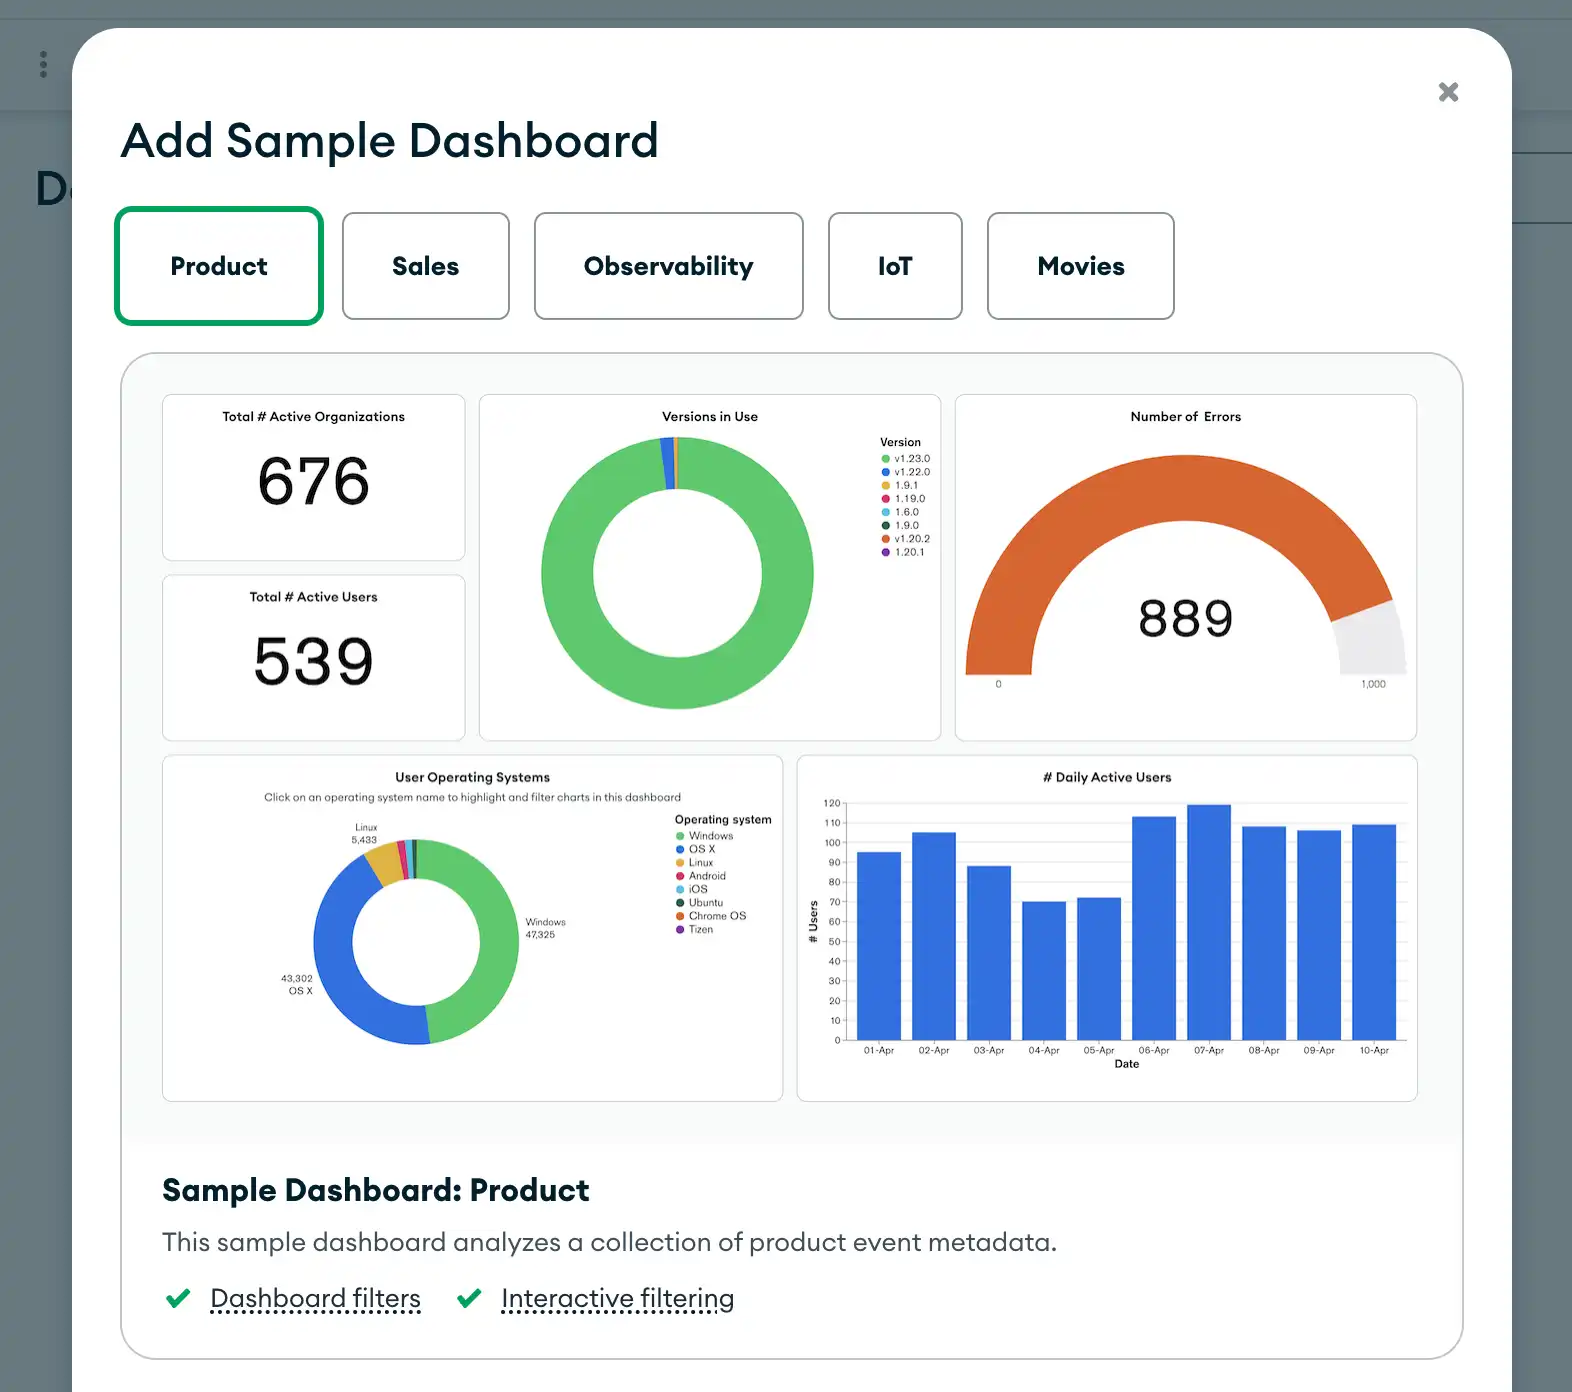
In the Add sample dashboard modal, select a category of sample data with which to create a sample dashboard. You can choose from the following sample dashboards:

  • Product event metadata

  • Sales records

  • System metrics for observability

  • IoT time series data

  • Movie data

Note

Each of the above links provides a public preview version of a sample dashboard where you can experiment with dashboard filtering and interactive filtering.
3

Click Add and Open to create a new Sample Dashboard of which you are the Owner.
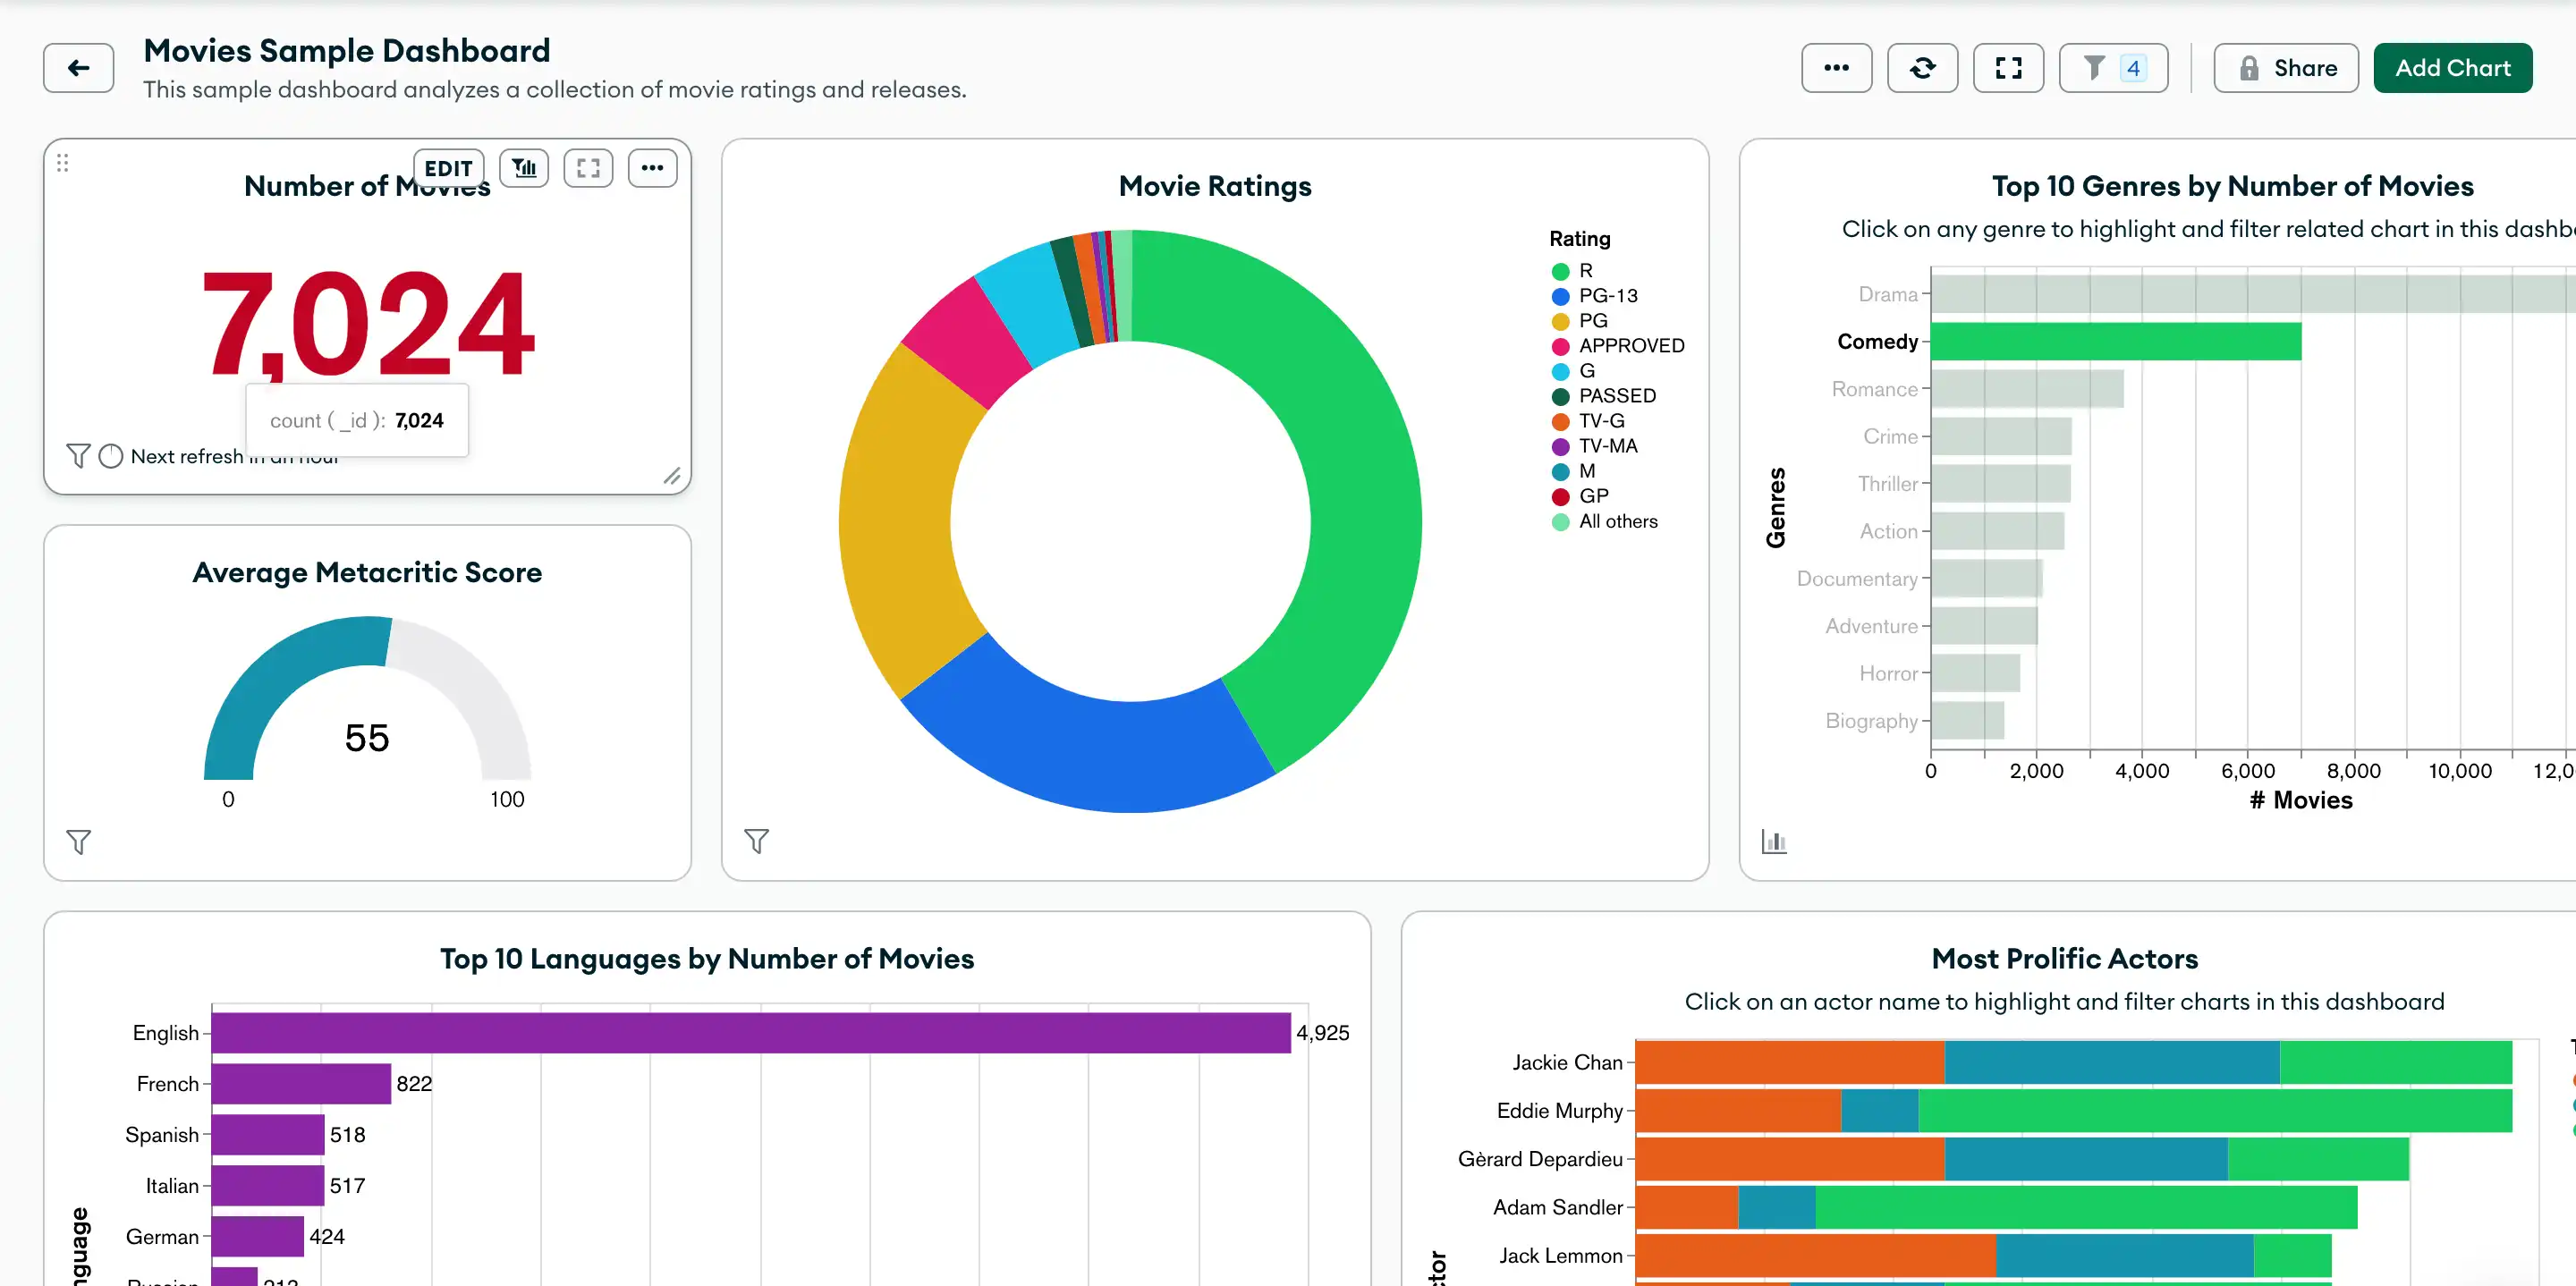
You can also create a Sample Dashboard by going through the Charts Welcome Experience.

Sample dashboards come with preset example dashboard filters. You can adjust these filters to modify the data that appears on your dashboard. To learn more about filtering dashboard data, see Filter Dashboards by Field Values.

You can add a billing dashboard in Charts to visualize your Atlas billing data. Billing dashboards contain prebuilt charts with insights into your Atlas usage. To learn more, see Create and Manage Billing Dashboards.

MongoDB Charts automatically refreshes chart data once it becomes out of date with the backing data source. You can also manually refresh dashboard data at any time.

To learn how to configure refresh settings and underlying refresh behavior, see Refresh Dashboard Data.

The data underlying a chart can be exported as a table. All viewers of public dashboards and authenticated users of non-public dashboards can view and export data. To view the chart data, click View chart data from the menu. Each row in the table represents a data point.

Important

Data Table Differs from Chart Visualization

Some configuration options you see reflected on a chart visualization are not applied to the data table. The Chart Data table displays underlying data retrieved with your full aggregation pipeline, and not all Chart Builder configuration options apply aggregation stages. Review your data to verify its contents.

If you want to analyze your underlying data with a third-party tool, you can download your data from the Chart Data modal. To download your data, click Download - CSV or Download - JSON.

Note

Viewing chart data will display a table of the values used to create a chart. It also allows for downloading a CSV or JSON representation of that table.

You can export a dashboard to a file, which you can then import. Use this feature to:

  • Store your dashboard outside of MongoDB Charts

  • Import exported charts into the same or a different project

You can export a dashboard to a single file named <Dashboard-Title>.charts. You can export a dashboard from the Dashboards page or from the dashboard itself.

To export a dashboard:

1

If you are on the Dashboards page, click the ellipsis (...) for the dashboard you want to export. If you are already viewing a specific dashboard, click the ellipsis (...) in the top right corner.

2

Click Export as .charts.

The <Dashboard-Title>.charts file contains the metadata for the dashboard, including:

  • Dashboard name and description

  • Dashboard layout including location of the charts in the dashboard

  • Chart definitions

  • Dashboard filter definitions

  • Details of the data sources used on the charts including:

    • Cluster name

    • Database name

    • Collection name

  • Embedding settings for each chart including:

    • Whether each embedding type is enabled or disabled

    • Filter allow list

    • Injected filter code

The <Dashboard-Title>.charts file does not include:

  • Dashboard permissions

  • External sharing settings for the data sources used

  • Data source pipelines

  • Chart embedding IDs

You must have Viewer or higher permissions to export a dashboard.

You can import a dashboard from a file on the Dashboards page.

The file to import:

  • Can't be larger than 16 MBs

  • Must be a valid .charts file that you downloaded from a dashboard

To import a dashboard from a file:

1

From the Dashboards page, expand the Add Dashboard dropdown menu and select Import Dashboard.

2

In the Import Dashboard modal, drag and drop the file to import or click Choose File and select the file to import.

3

Click Next.

4

Click the pencil icon under Data source at destination.

5

Select the Data source at destination for each Data source in file.

The Import Dashboard modal displays a list of all of the data sources you are importing under the Data source in file column. To connect each data source from your imported dashboard to a data source in your destination project, choose one of the following options under the Data Source at Destination column:

Option
Description
Connect later
Option to choose the data source to use later. MongoDB Charts imports all charts using the Data source in file, but no data source is selected. The charts don't render until you edit each chart and choose a new data source.
Connect now

Option to select any data source in your project. The data source you select is used instead of the Data source in file for charts imported in to the dashboard.

If MongoDB Charts detects that a data source in your imported dashboard is the same as the data source in your destination project, that data source is selected by default. Otherwise, Connect later is selected by default.

To select a data source:

  1. Select a deployment from the first dropdown.

  2. Select a database from the second dropdown.

  3. Select a data source from the third dropdown.

  4. Click Save.

Exclude charts using this data source
Option to exclude charts that use the Data source in file. Charts that use the Data source in file won't be imported.
6

Click one of the following buttons:

  • Save to import the dashboard.

  • Save and Import Another to import this dashboard and import another dashboard from a file.

  • Cancel to exit the modal without importing the dashboard.

MongoDB Charts provides a fullscreen view for dashboards. In this view, MongoDB Charts hides the main navigation bar and expands the dashboard to show the title, description, time of last modification, and charts in the entire space of the screen.

To enter the fullscreen view for dashboards:

1

Select a dashboard from the Dashboards page.

2

Click at the top-right of the dashboard.

Note

In the fullscreen view for dashboards, you can still:

To exit the fullscreen view for dashboards, do one of the following tasks:

  • Click at the top-right of the dashboard.

  • Press the escape key.

←  Arrange the Charts on the DashboardManage Existing Dashboards →
Share Feedback
© 2023 MongoDB, Inc.

About

  • Careers
  • Investor Relations
  • Legal Notices
  • Privacy Notices
  • Security Information
  • Trust Center
© 2023 MongoDB, Inc.