Aggregation pipelines transform your documents into an aggregated set of results. In Atlas Charts, aggregation pipelines are commonly used to visualize new fields created from calculated results of pre-existing fields, but also have many other applications.
To create an aggregation pipeline:
In the Query bar, input an aggregation pipeline. Your pipeline must be in square brackets.
(Optional) Select Format to arrange the query as follows:
Split the query across multiple lines
Indent the query as per JSON conventions
(Conditional) If you selected the Format option, click Close when you finish.
Click Apply to execute your pipeline.
Example
The following chart shows total sale amounts from an office supply company, categorized by store location. The chart uses the following aggregation pipeline in the Query bar:
[ { $unwind: "$items" }, { $addFields: { saleAmount: { $multiply: [ "$items.price", "$items.quantity" ] } } } ]
This aggregation pipeline processes the collection data using the following order:
The
$unwindstage unwinds theitemsarray and outputs a new document for each item in the array. Each element in theitemsarray contains a single item sold during a transaction.The
$addFieldsstage adds a new field to the documents calledsaleAmount. The$multiplyexpression sets the value ofsaleAmountto the product ofitems.priceanditems.quantity. You can see this new field highlighted in the following screenshot:

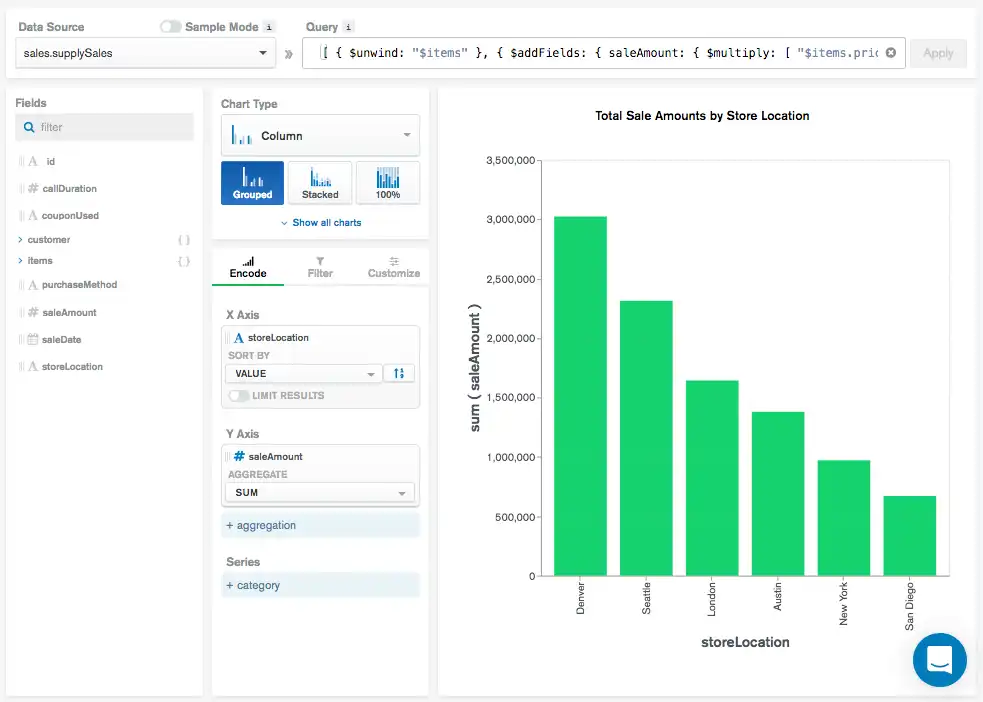
Once the data has been processed using the pipeline, the
chart displays the Sum of all
saleAmounts categorized by store location.
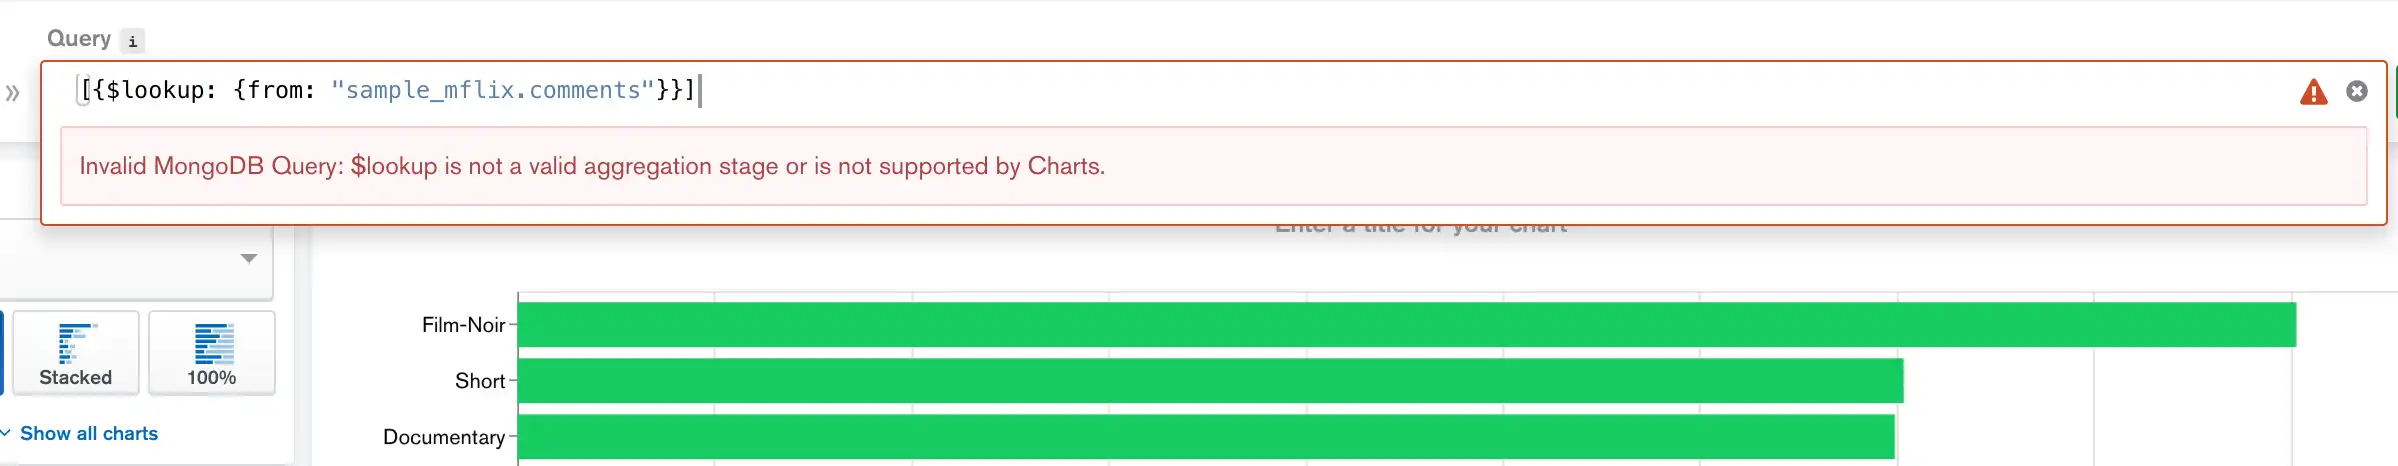
Address Aggregation Pipeline Errors
If your aggregation is invalid, Charts displays the icon in the Query bar.
Click the Query bar if it is not already displayed to view error details. Charts displays error details for:
Client-side errors, such as malformed JSON, and
Server-side errors, such as invalid MQL or unsupported pipeline stages.

Review the error details, then adjust your aggregation pipeline accordingly.
Limitations
Charts doesn't support the
$lookupoperator in aggregation queries. However, you can use this operator in Data Source pipelines. To learn more about how to use pipelines to pre-process data before it reaches the Chart Builder, see Create and Manage Charts Views.Charts supports the
$functionoperator only when you define the function body in a single line and wrap it in double quotes. To use this operator in your aggregation queries, you must use the following syntax:{ $function: { body: "function(arg1, arg2, ...) { ... }", args: <array expression>, lang: "js" } }