Geospatial data defines specific geographical locations, either in the form of latitude and longitude coordinates or text fields with names of geographical areas, such as countries or states. Geospatial charts combine geospatial data with other forms of data to create map-based charts. MongoDB collections can store geospatial data as GeoJSON objects or as legacy coordinate pairs.
Geospatial charts can visualize geospatial data in a variety of chart formats, including choropleth, scatter, and heatmap.
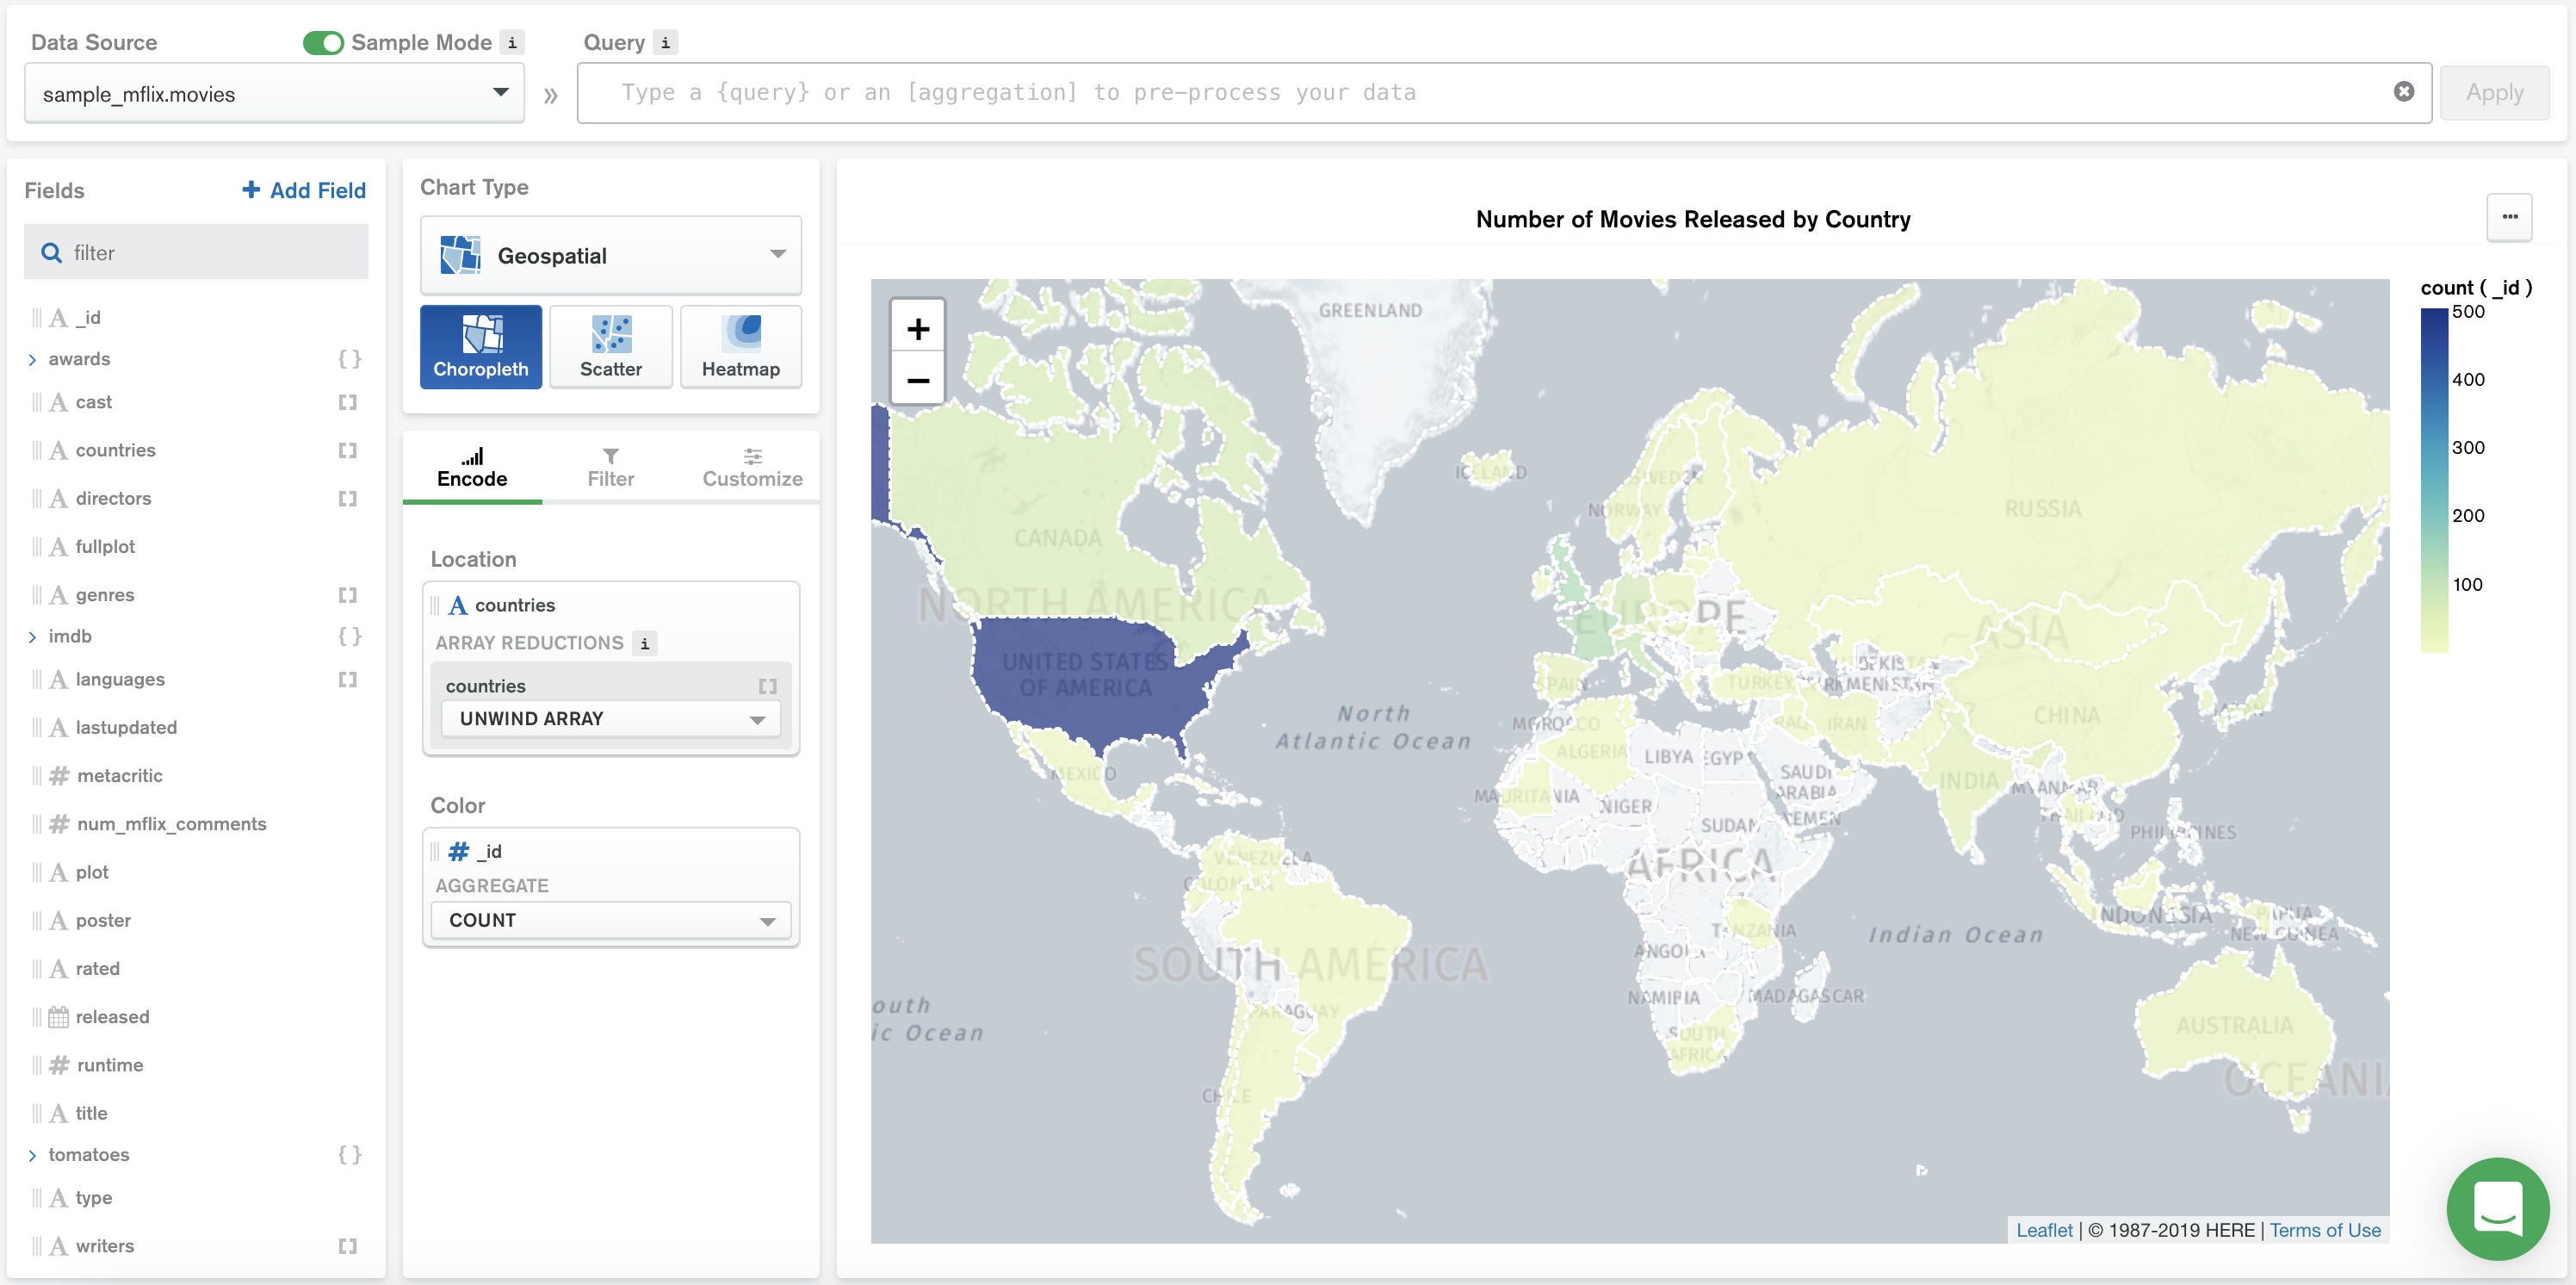
Choropleth
Choropleth charts use predefined shapes for geographical areas, e.g. the countries of the world, or the states of the United States. They are useful for comparing aggregated values across defined geographical areas.
Scatter
Scatter charts use customizable data markers to indicate data points on a map.

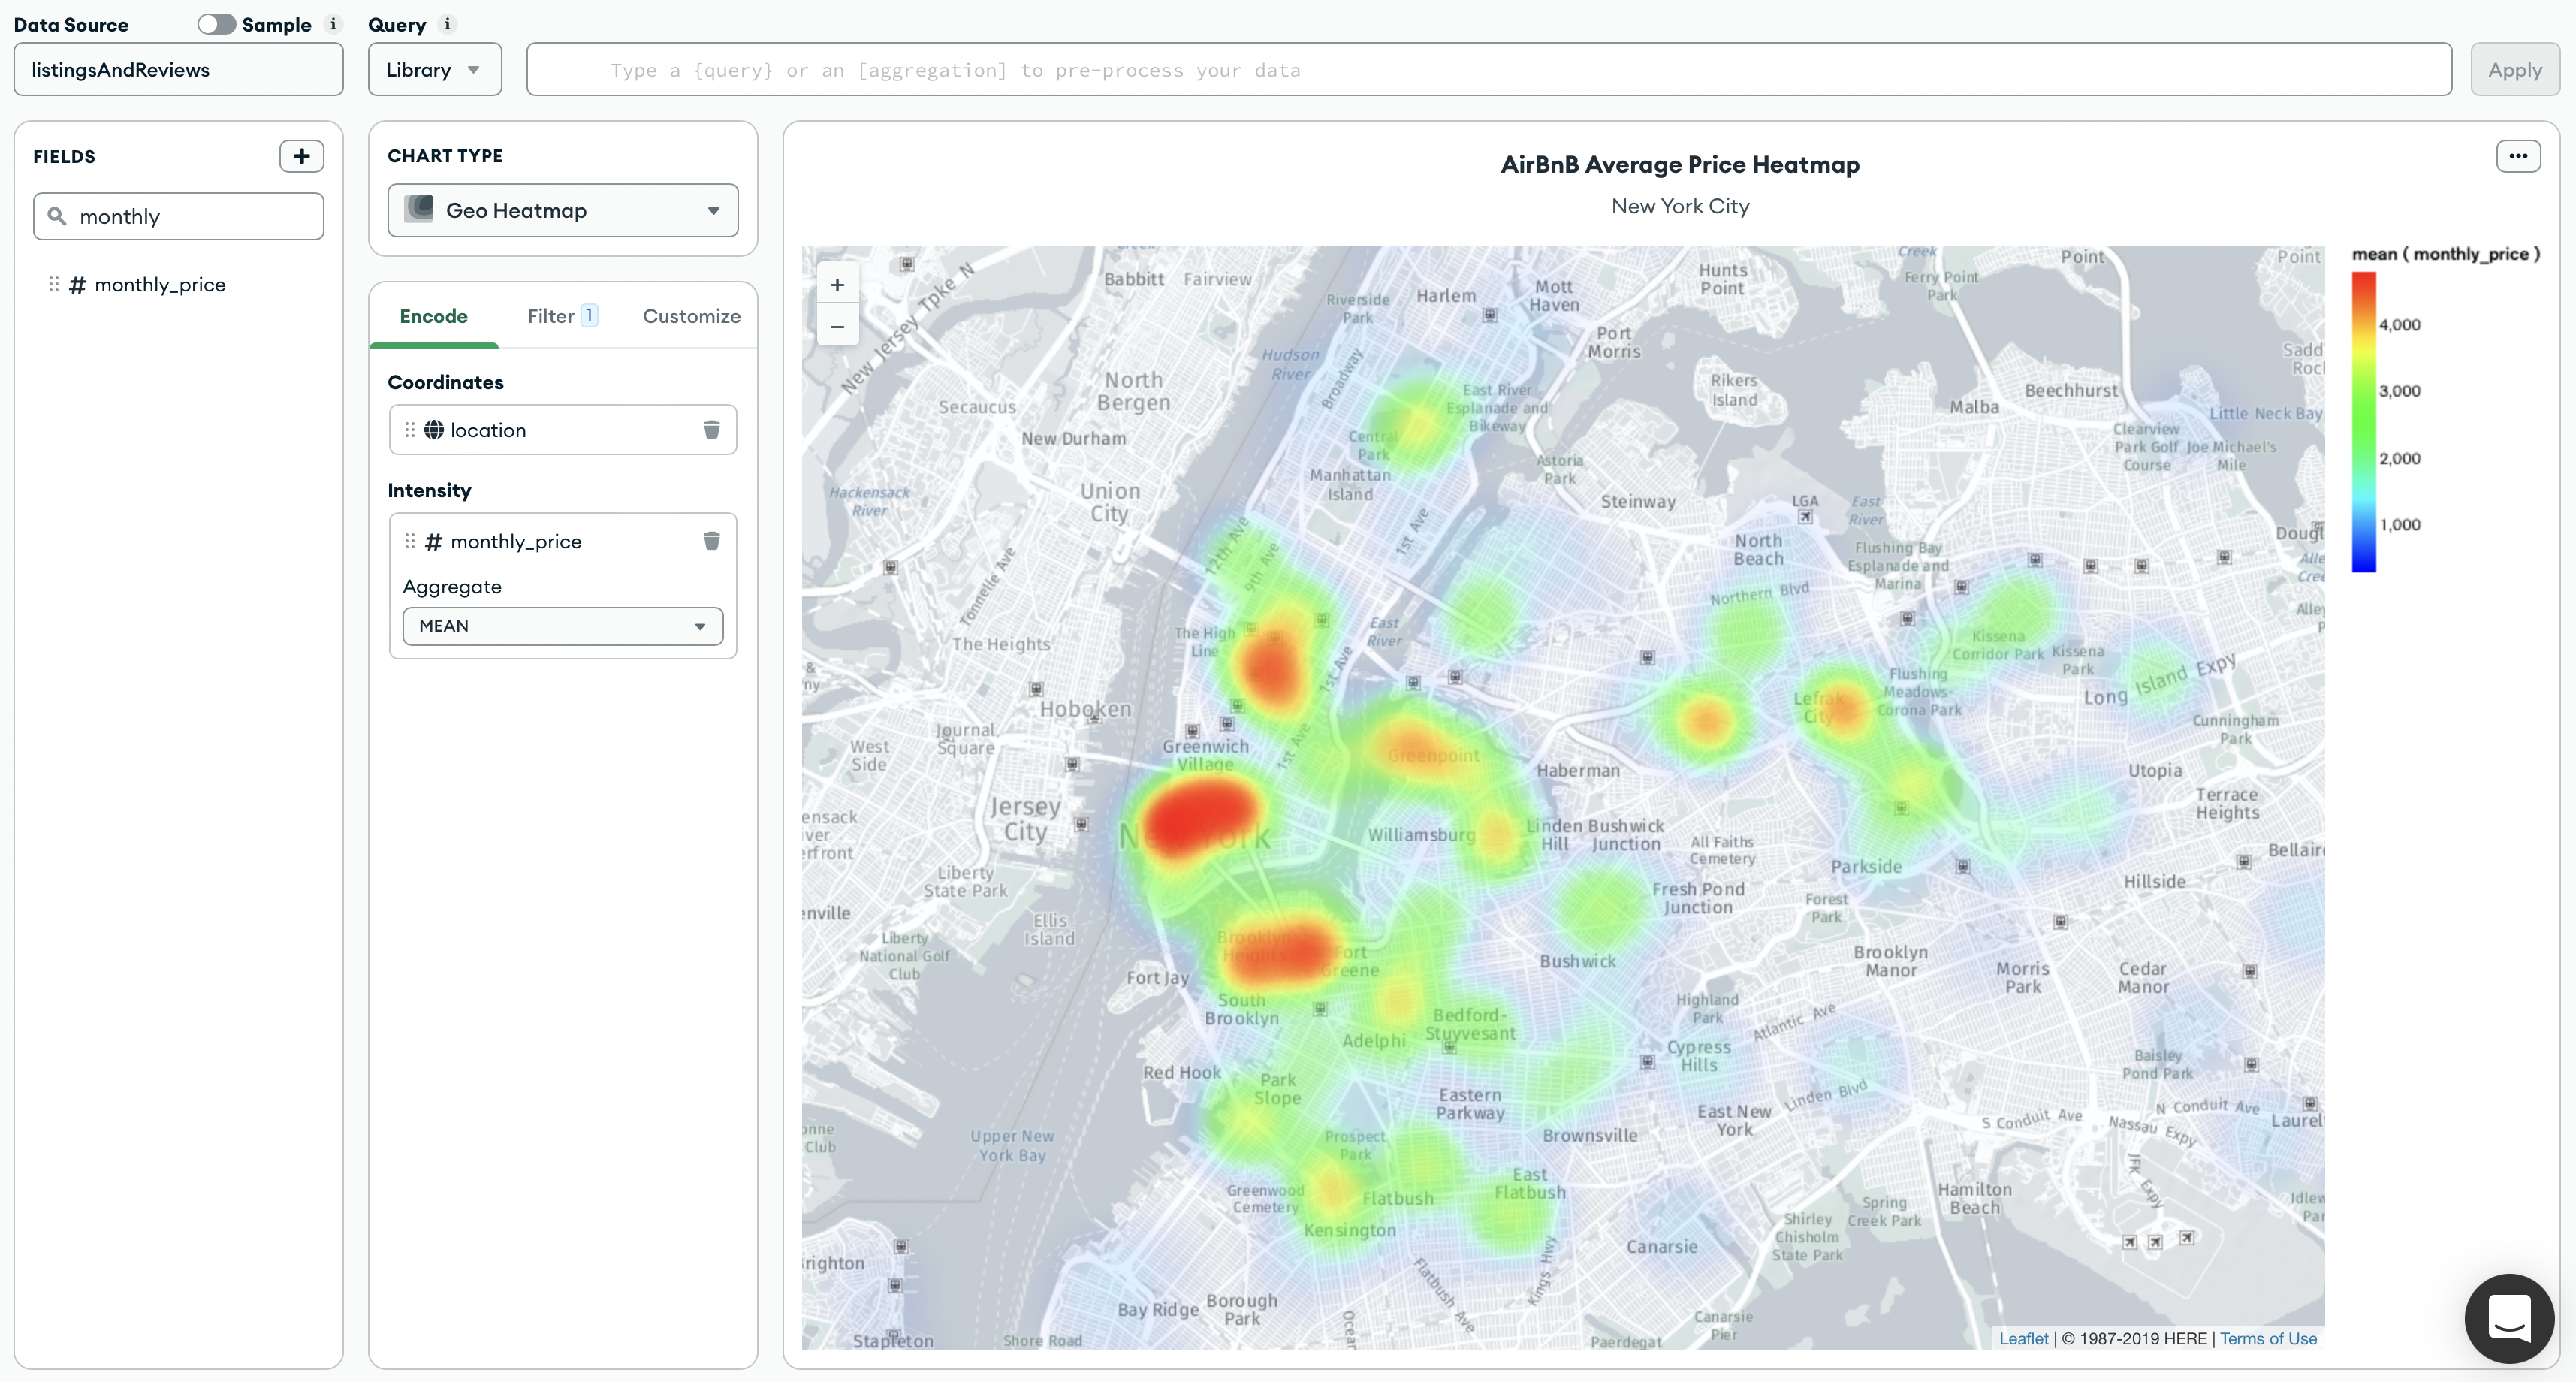
Heatmap
Heatmap charts use gradations of color intensity to compare concentrations of data points on a map.