Docs Home → View & Analyze Data → Atlas Charts
Schedule Dashboard Reports
On this page
You can create, edit, and delete scheduled reports for your dashboard. A scheduled report automatically sends a snapshot of dashboard data to a group of users at a regular frequency.
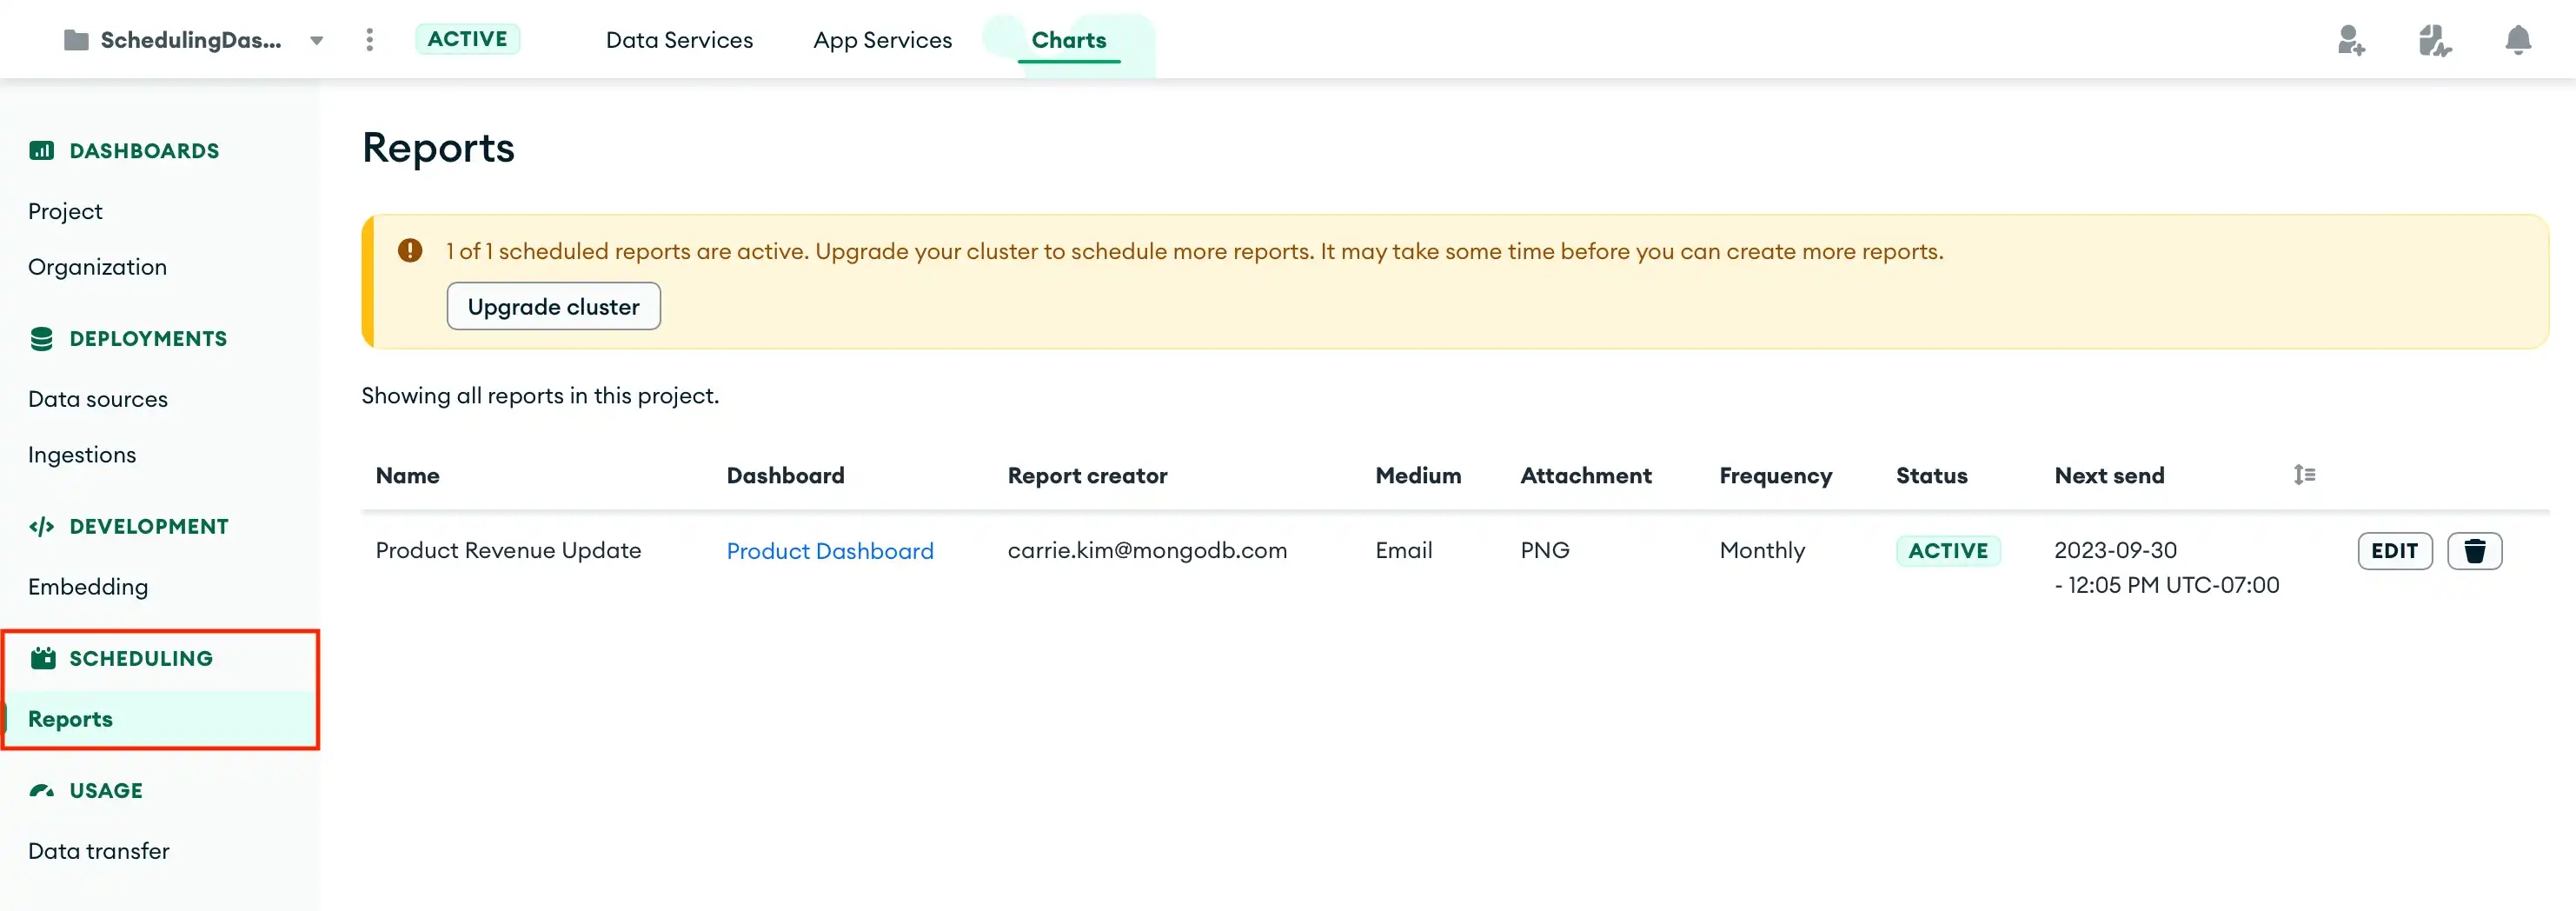
To view your scheduled reports, click Reports in the sidebar of the Charts UI, under Scheduling.

Required Permissions
To create, edit, and delete scheduled reports for a dashboard, you must have:
The Owner dashboard permission role for your Charts dashboard.
Write access to your Atlas project through an Atlas user role.
Note
If you have the Project Owner user role, you can view all of the
scheduled reports in a project. To edit and delete reports for that dashboard,
you must also have the Owner dashboard role.
Limitations
For
M0clusters, you can create one scheduled report per project.For
M2and higher tier clusters, you can create up to 100 scheduled reports per project.At this time, scheduled reports can only be sent by email.
Create a Scheduled Report
To create a new scheduled report:
Configure your dashboard report.
Provide the following information:
Field | Description |
|---|---|
Name | The name of your report to show on the Reports
page. For email reports, this is also the subject line. |
To | The list of recipients to whom to send your report. You can specify any combination of the following:
NoteYou can specify a maximum of 10 external email addresses. |
Message | (Optional) A message to send with your report. For email
reports, this is the email body. |
Attachment | The type of file to use for the dashboard report. You can select either PNG or PDF. If you select PDF, you must also select an orientation for the report document. |
Schedule or send your report.
You can create a schedule for a recurring report, or send a single report immediately.
To schedule a recurring report:
Toggle the switch to Schedule.
Specify a start date and time. The first report will be sent at this time.
Select a frequency from the Frequency dropdown. You can select:
Once
Daily
Weekly
Monthly
Quarterly
Select a timezone from the Schedule dropdown.
Click Schedule.
Charts adds your new scheduled report to a list of reports for your project. To view this list and to edit your scheduled reports, see Edit a Scheduled Report.
To send a single report immediately:
Toggle the switch to Send now.
Click Send now.
Charts sends your report immediately. The report isn't added to the list of scheduled reports for your project.
Edit a Scheduled Report
To edit an existing scheduled report:
Delete a Scheduled Report
Any dashboard owner of a particular dashboard can delete a report.
Note
Dashboard owners that have the Project Read Only role cannot create or delete dashboards.
To delete an existing scheduled report:
