You can visualize your Atlas billing data in Atlas Charts by creating a billing dashboard. Billing dashboards are dashboards with prebuilt charts that help you monitor your Atlas usage. After you ingest your billing data, you can add a billing dashboard and customize it to suit your specific billing needs.
To learn more about how Atlas bills your deployments, see Manage Billing.
Billing Dashboards
Billing dashboards provide metrics and detailed charts about the usage in an organization across different categories and periods of time. The insights from your dashboard can help you optimize your Atlas spending.

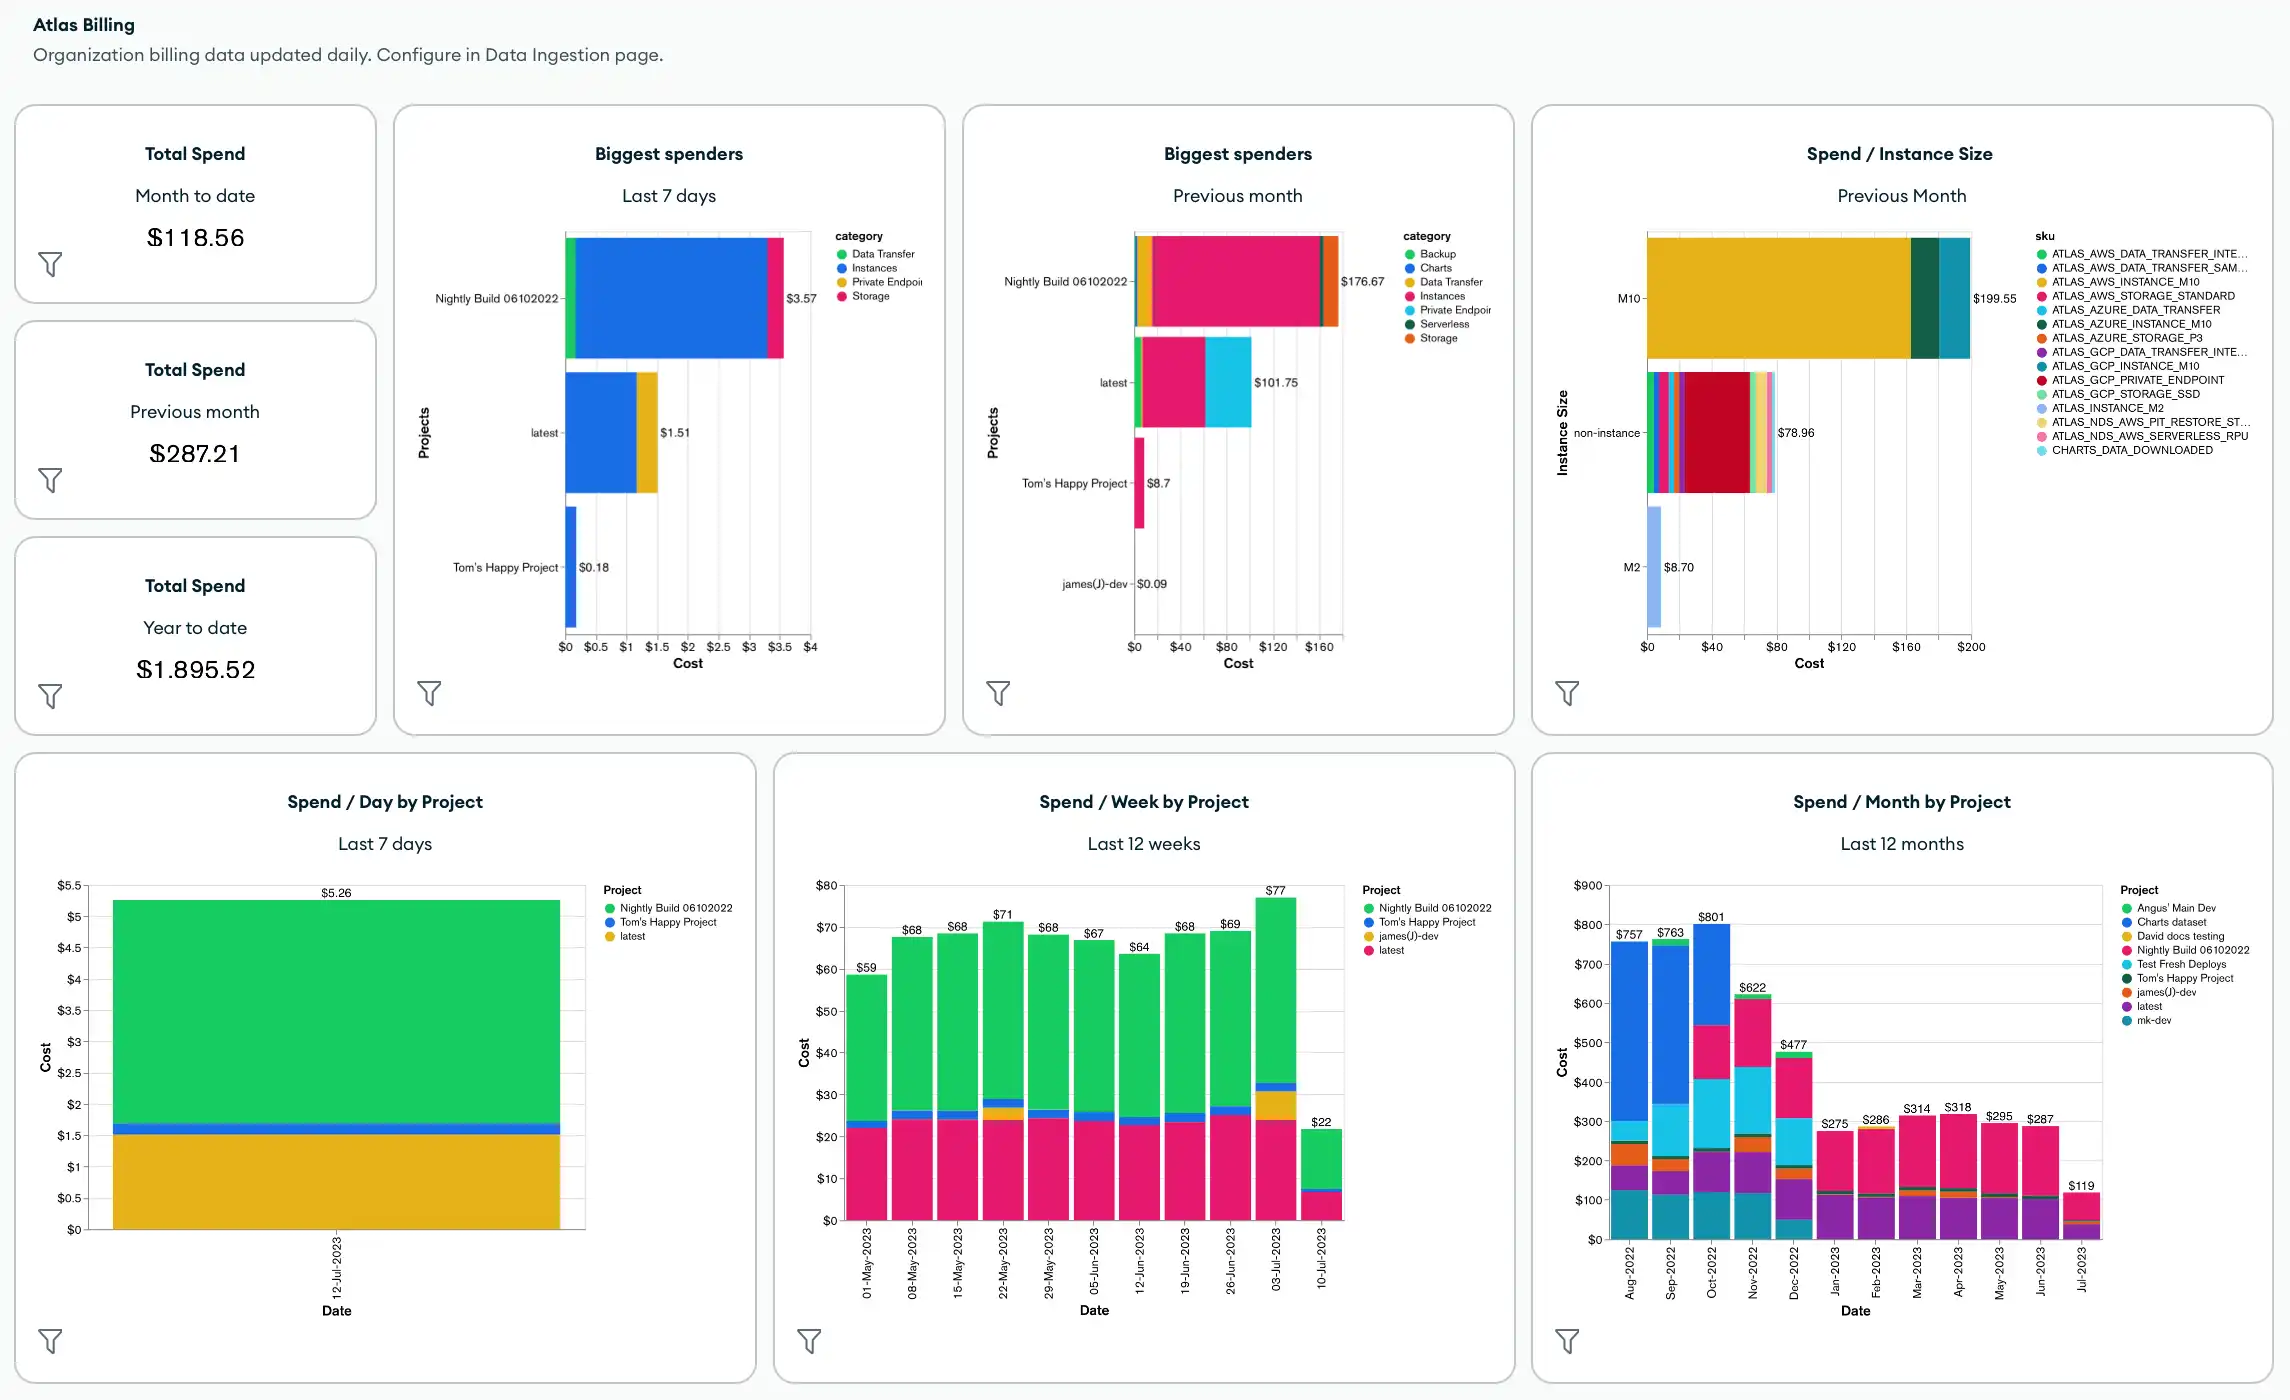
By default, billing dashboards include the following metrics and charts:
Total spending across the organization
Biggest spenders in the organization
Total spending by instance size, project, cluster, product category, or SKU
Total cost by product category
You can also customize your billing dashboard by applying dashboard filters and adding new charts, including any charts that use tags that you've applied to your billing data.
Required Access
To create a billing dashboard, you must have at least
Project Data Access Read/Write permissions.
Limitations
At any given time, billing dashboards use the last twelve months of the specified organization's billing data.
If you enable linked invoices on an existing ingestion, the billing dashboard uses the last three months of each linked organization's billing data. If you enable linked invoices on a new ingestion, it uses the last twelve months of data.
If you change an existing invoice, Atlas updates the billing data in your ingestion only if you've incurred the invoice within the last three months. Any invoice changes reflect in your dashboard after the next scheduled ingestion.
If you've created an ingestion previously and want to create a new ingestion, you must specify a new database to store the billing data for the ingestion or delete the old database if you want to use the same database name.
Create a Billing Dashboard
To ingest your billing data and add a billing dashboard:
Go to the Ingestions page.
Click Ingestions under the Services heading in the Visualization sidebar.
The Ingestions page displays.

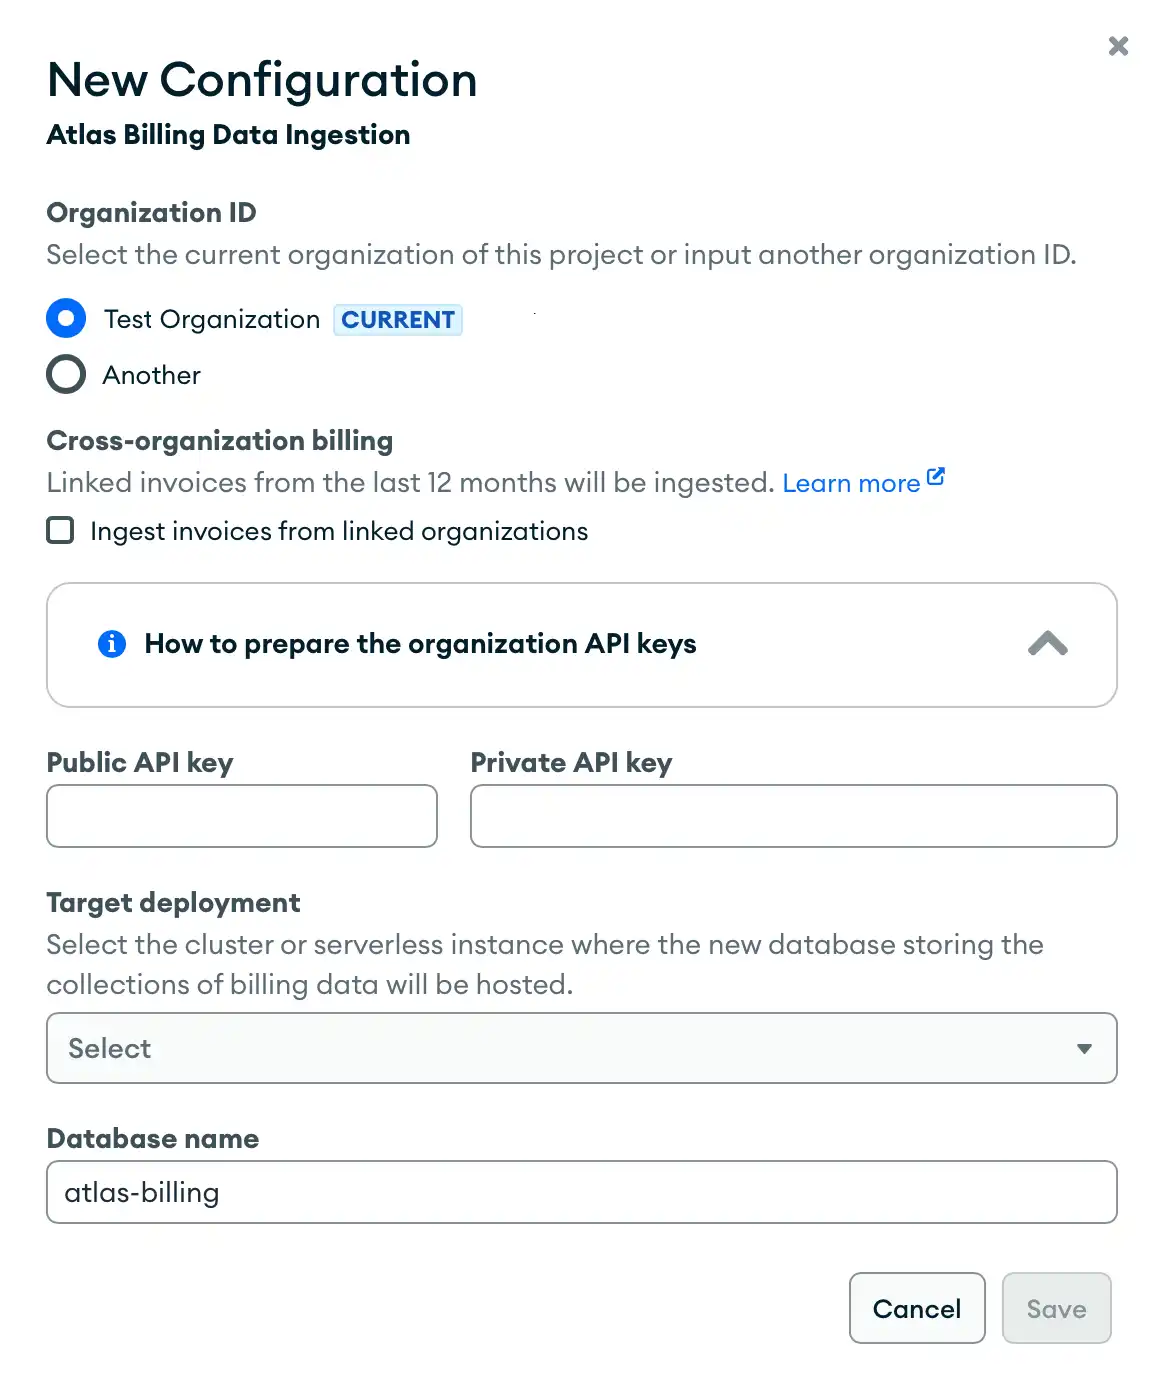
Configure the Atlas Billing Ingestion.
Specify the organization for which to create the billing dashboard. By default, Charts selects the current organization.
To use a different organization, select Another and specify the Organization ID. You can find the Organization ID in the specified organization's settings.
Note
If you use cross-organization billing, specify the Organization ID for the paying organization.
Enable or disable ingesting invoices from linked organizations.
Enter the Public API key and Private API key for the specified organization.
Your key pair must have at least
Organization Billing AdminandOrganization Billing Vieweraccess.To learn how to create and view an API key for an organization, see Grant Programmatic Access to Atlas.
From the dropdown, select the Target deployment to store your billing data.
(Optional) Change the Database name.
Click Save.
Charts uses the Invoices API to ingest the last twelve months of the specified organization's billing data into the specified deployment and database. After you create the initial ingestion, Atlas ingests billing data daily.
In the Atlas Billing card, click Add and Open.
Charts generates the billing dashboard and saves it to the Dashboards page. All dashboard and chart features, such as dashboard filters and interactive filtering, apply to billing dashboards and its prebuilt charts.
To learn more about filtering billing dashboards, see Apply Dashboard Filters.
Apply Dashboard Filters
You can use dashboard filters to refine the charts across your billing dashboard. By default, billing dashboards include filters on the following fields from your billing data:
nameclustercategorysku
To view active filters, click the filter icon in the top-right corner of your dashboard to expand the Dashboard Filters pane.
In the Dashboard Filters pane, you can manage your active filters or click Edit to add and apply new filters. When you apply a filter, the charts in your dashboard update to display only data that matches the field values that you filtered on.
To learn more, see The Dashboard Filters Pane.
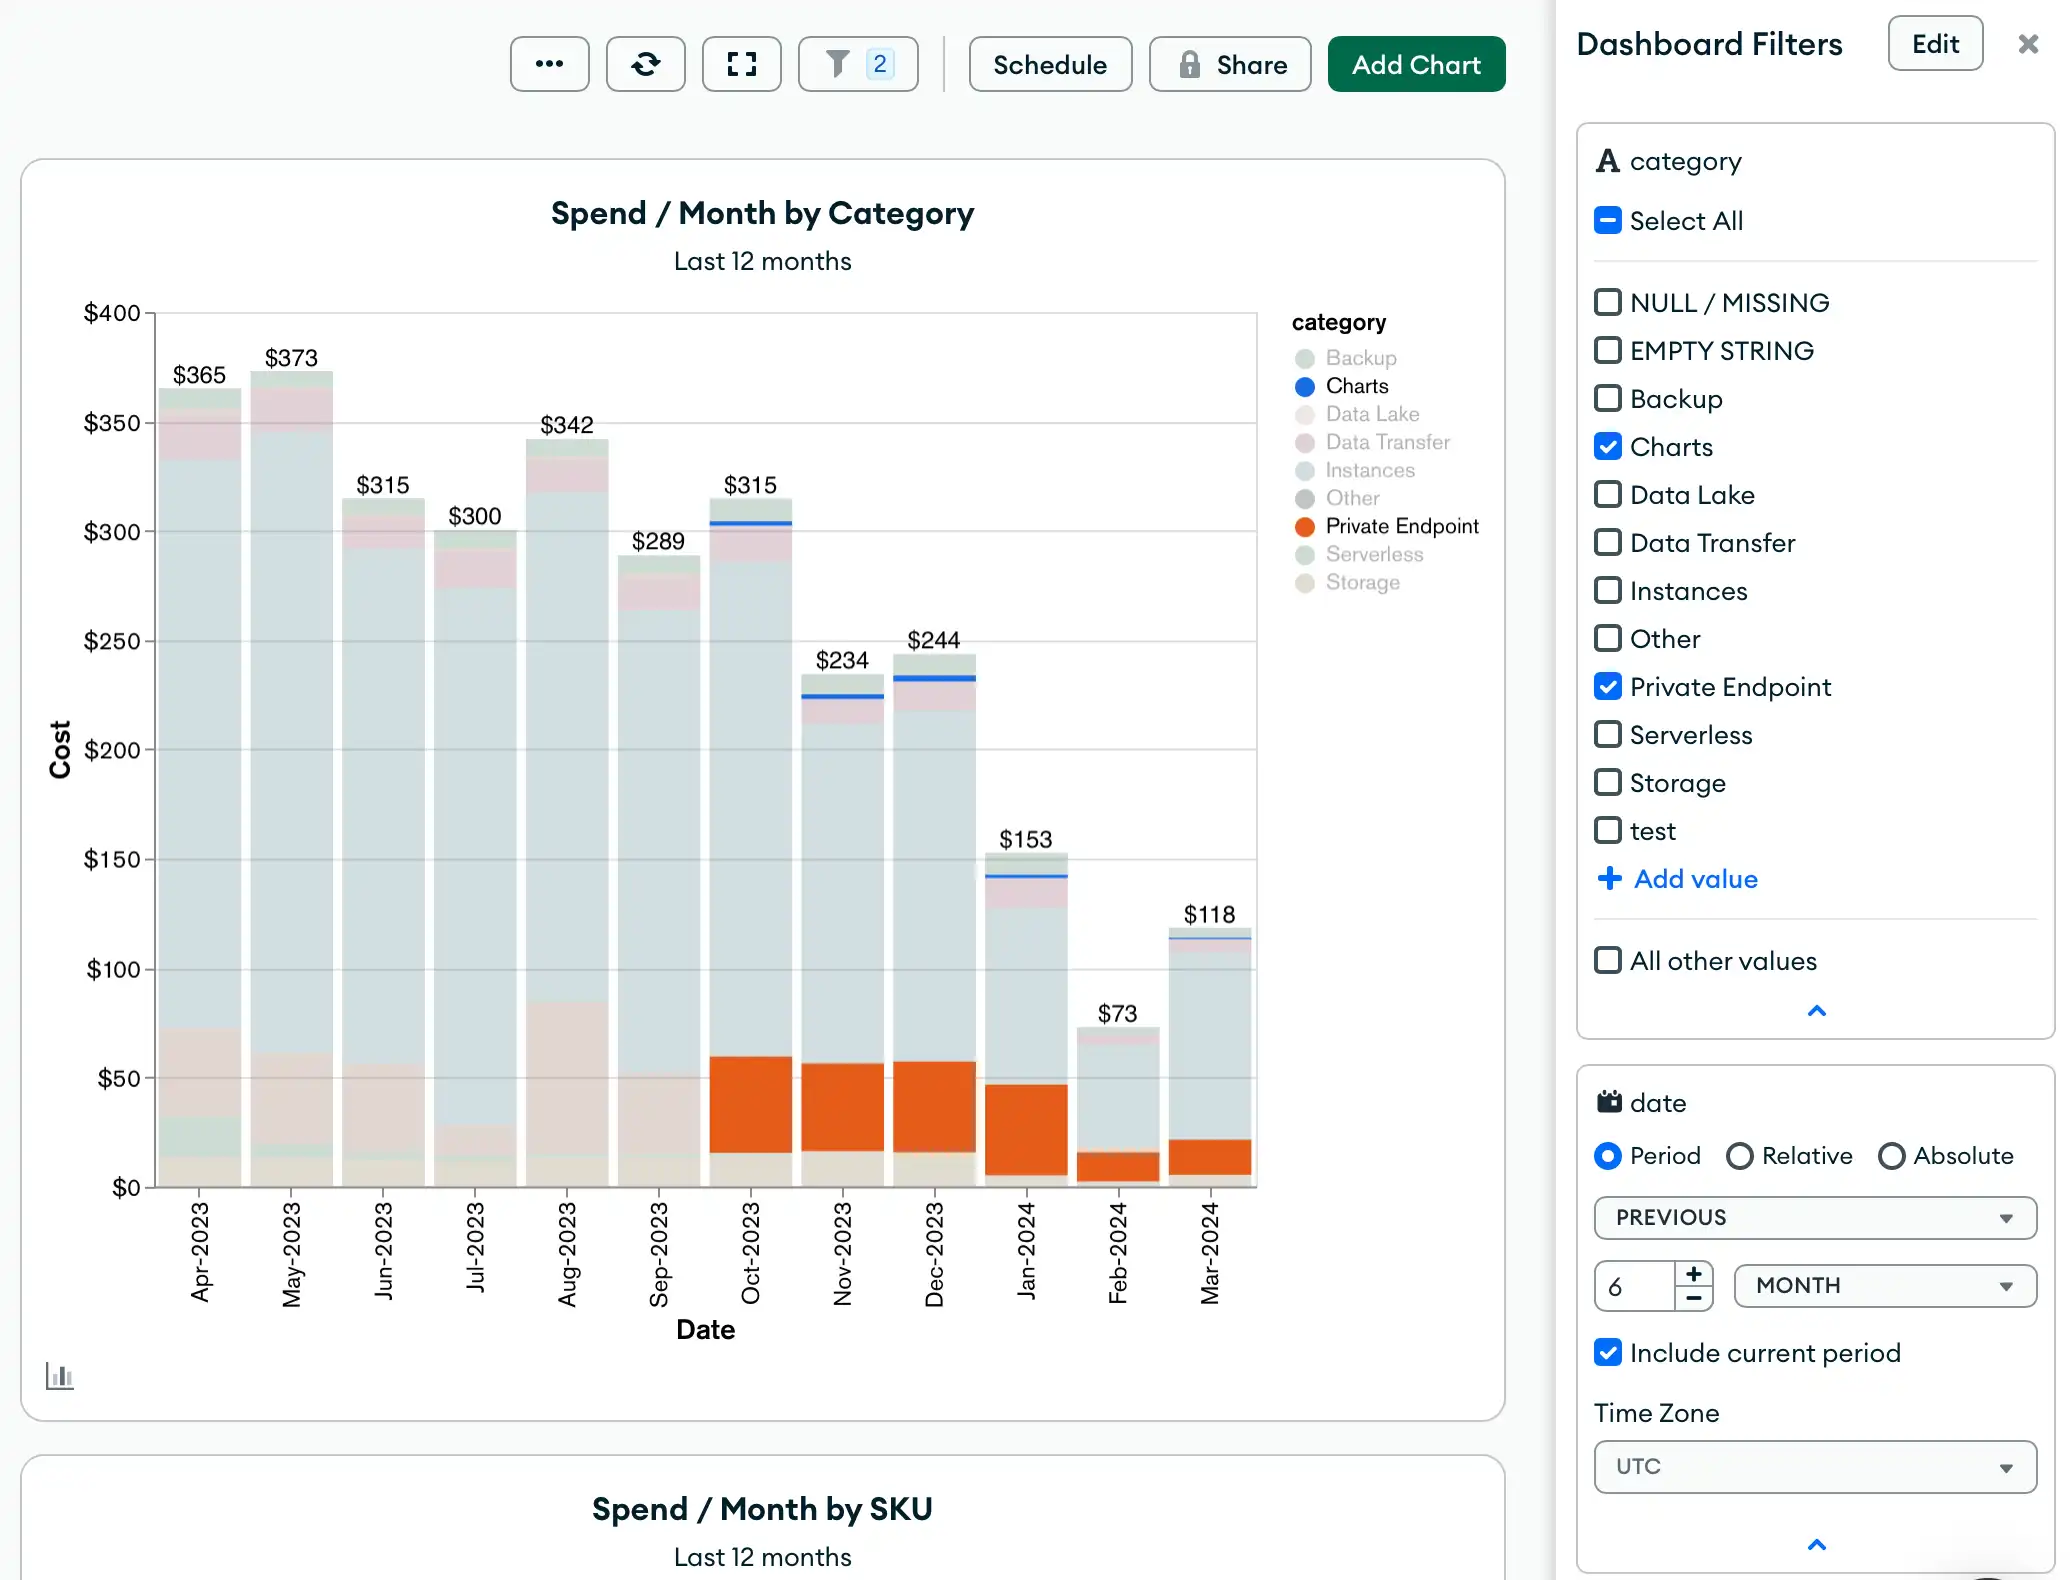
Example
Consider a sample billing dashboard that uses the following filters:
A filter on the
categoryfield to include only invoices related to the Charts and Private Endpoint categories.A filter on the
datefield to include only invoices incurred within the past 6 months.
Once the filters are applied, the charts in the billing dashboard highlight only the values specified in these filters. For example:

Manage Atlas Billing Ingestions
Edit an Ingestion
To edit an existing billing ingestion:
Go to the Ingestions page.
Click Ingestions under the Services heading in the Visualization sidebar.
The Ingestions page displays.
Delete an Ingestion
To delete an existing billing ingestion:
Go to the Ingestions page.
Click Ingestions under the Services heading in the Visualization sidebar.
The Ingestions page displays.