Atlas Charts is the native data visualization that lets you create, share, and embed charts from data in MongoDB Atlas. Today, we are happy to announce the release of Dashboard Embedding.
What is an embedded dashboard?
Embedding provides the ability to bring charts and dashboards into any webpage or application where your users spend time. It’s a great way to share dynamic, live visualizations with a wide audience. We see customers using embedded charts to share real-time information internally within their companies, as well as externally with their customers.
Until now, embedding multiple charts where you need them has been time consuming and somewhat complex. With dashboard embedding, rather than individually embedding one chart at a time, you can embed a full dashboard in one go! Embedding charts and dashboards is easy to use and provides the flexibility you need when it comes to visual customizations and data security. This ensures you are able to freely share information and have it look the way you want, while always keeping data secure.
How does Dashboard Embedding work in Atlas Charts?
Enabling Dashboard Embedding is as simple as picking a dashboard, going into the Embed menu, and enabling either authenticated or unauthenticated embedding as shown below.
The Dashboard Embedding Menu
Similar to embedding an individual chart, you can publicly embed a URL in an iFrame of your application or website. Unauthenticated embedding allows you to embed your dashboards, and have visualizations immediately ready for public consumption. Alternatively, you can use our embedding SDK to implement authenticated embedding. Authenticated embedding provides more control and security, requiring users to have appropriate permission to access your dashboard. We support Google, Realm and Custom JSON Web Token authentication options.
Charts offers a number of configuration options important to ensuring your embedded dashboards look and feel how you want. These options include support for dark mode, background color selection, chart sizing, and refresh rate cadence. Dashboards can even be set to resize responsively based on your screen size, ensuring a consistent user experience.
Play around with dashboard embedding and some of these features in our code sandbox.
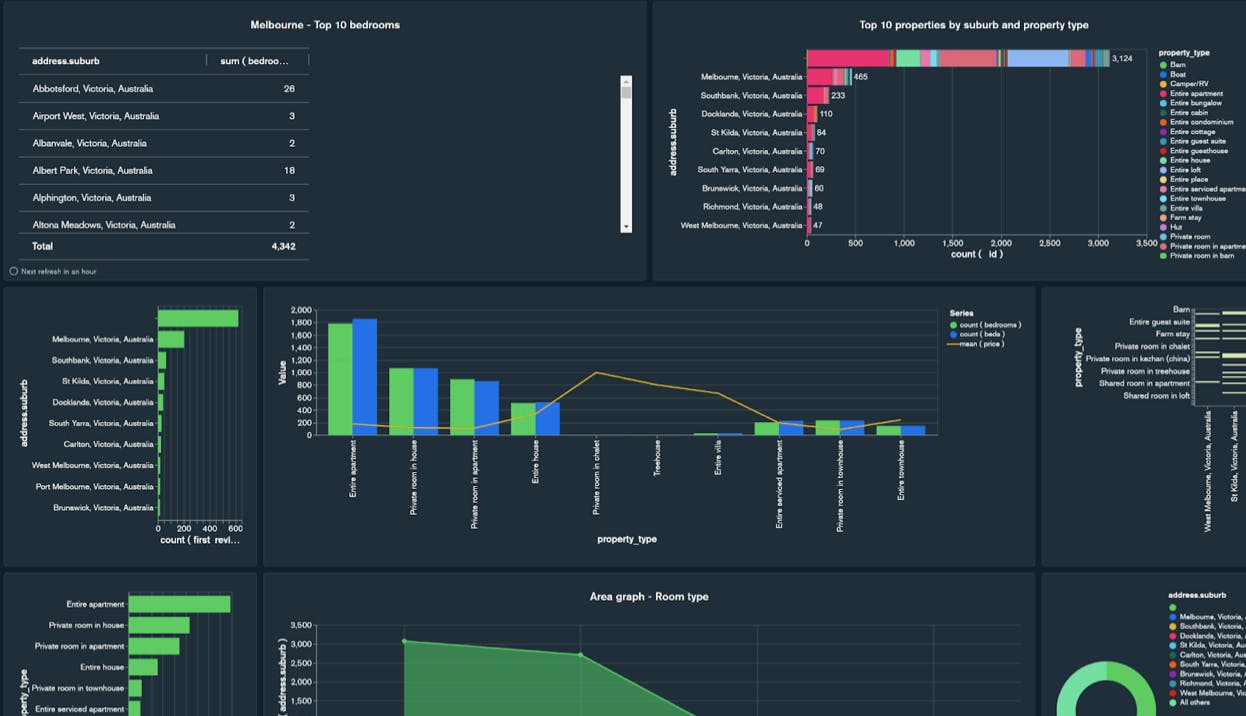
An embedded dashboard in dark mode
Get started today!
Dashboard Embedding was one of our most frequently requested features in Atlas Charts and we are excited to see how you take advantage of it in your applications! Head over to any of your dashboards in Charts to enable dashboard embedding or take a look at Github to get started with the embedding SDK.
New to Atlas Charts? Get started today by logging into or signing up for MongoDB Atlas, deploying or selecting a cluster, and activating Charts for free.