Overview
An execution trace is a record of everything that happens while your agent processes a request. It shows which steps run, how long each one takes, and how many tokens each model call uses. Each time your agent runs, the Atlas Agent Engine records a trace automatically.
Use traces to answer two kinds of questions:
What happened? Traces show the sequence of tool calls, model calls, and other steps an agent takes to produce a response. Check this when a run produces an unexpected or wrong result.
Why was it slow? Traces show how long each step takes, so you can find the specific step responsible for a slow run instead of guessing.
A trace is composed of three levels: a session, its runs, and each run's steps. A session is a conversation thread with a unique session ID, created whenever your agent is invoked. A session can contain several runs, one for each execution turn. A run, in turn, can contain several steps: the individual operations an agent performs, such as a model call or a tool call. To learn what each step kind means, see Step Kinds later on this page.
You can view traces in two places:
The Playground, where a Traces drawer on the right side of the page shows the trace for your own interactive test sessions as they run.
The Traces page, under Monitor, which shows every session in the project across all workspaces. A session appears here regardless of whether your agent was invoked through the Playground, the UI, the REST API, or the CLI, so this is where you find real end-user activity. The Playground only ever shows your own sessions.
Step Kinds
Every step in a trace has a kind, displayed as an icon and a label. The following table describes each kind:
Kind | Description |
|---|---|
LLM (large language model) call | A call to a large language model, such as generating a response or deciding which tool to use next. |
Tool call | A call to a tool the agent has access to, such as a database query or an external API request. |
Memory | A read from or write to the agent's memory store. To learn more, see Add Memory to Your Agent. |
Guardrail | A content check applied to the agent's input or output. To learn more, see Use Content Guardrails. |
Policy check | A check of whether the agent is allowed to take an action, such as calling a specific tool or model. To learn more, see Policy Engine. |
Agent-to-agent call | A call from one agent to another agent in the same project, shown as Subagents in the Playground filter. To learn more, see Use Agent-to-Agent Communication. |
Graph node | A node in the agent's execution graph that isn't one of the other step kinds, such as a routing or control-flow step. |
Human review | A pause in execution while the run waits for a person to approve or reject an action. To learn more, see Human-in-the-Loop Agent Execution. |
Note
A long-running Human review step isn't a performance problem. The agent isn't doing any work while it waits for a decision.
Prerequisites and Access
You can view a project's traces with any org or project-level read role. These roles include Organization Admin, Organization Member, Project Owner, Project Member, and Agent Developer.
With permission from your organization, MongoDB support engineers can also view your traces through a read-only Data Viewer. An org admin grants this access for a limited time. While the grant is active, the Data Viewer shows the same sessions, runs, and steps as the Traces page. A banner in the Data Viewer states that the view is read-only, and identifies the grant's expiry. Step payloads, such as tool call inputs and outputs, are redacted in this view. To learn how to grant this access, see Grant Support Access.
View Traces in the Playground
The Atlas Agent Engine shows a Traces drawer next to the Playground chat panel. The drawer updates live as the current run executes. Turn on the Timeline toggle to show step duration bars alongside the chat.
The run summary at the top of the drawer shows the run's prompt and, if the run stopped or was blocked, a status badge.
Below the prompt, a summary line reports the run's total duration, the time to first event, and a count of steps by kind, such as "2 tools." Time to first event is the delay before the agent's first visible step. This is separate from the run's total duration, so a run can be slow to start without being slow to complete, or the reverse.
Each step in the run appears on the timeline with an icon, a label, and either a token count, a duration, or both, depending on its kind. Select a step to see its details: a model call shows its prompt, completion, and total token counts, while a tool call shows its input and output. Filter the list by category, such as LLM or Tools, to isolate one step kind when a run has many steps.
To stop a run in progress, use the stop control in the chat input bar. To learn more, see Stop a Run in the Playground.
View Traces on the Traces Page
The Traces page covers every session in the project across all workspaces. Use it to find a specific end user's session or a direct invocation.
Find a Session
The sessions list shows the following columns:
Column | Description |
|---|---|
Session | The session title, taken from the first message, and its run count. |
Session ID | The session's unique identifier. Copy this to cross-reference a session against the |
Duration | Total active time across all runs in the session, excluding idle time between runs. |
Tokens | Total tokens consumed across all runs in the session. This is a lower bound: it doesn't count some token usage, such as memory extraction. |
Workspace | The deployed agent that produced the session. |
Last activity | When the session was last updated. |
Latest run | The status of the most recent run in the session. |
Read the Runs Timeline
Opening a session shows its runs as a shared timeline. Three summary cards at the top total the session's duration, tokens, and memory activity (recalls and saves) across every run shown. The tokens and memory totals are lower bounds: they reflect only the runs and steps that have finished, so they can undercount while a run is still active.
A sort dropdown and an Elapsed time/Tokens toggle change how the timeline reads. The dropdown controls which run you see first. The toggle controls what a bar's length measures: duration in Elapsed time view and token count in Tokens view.
In Elapsed time view, the horizontal axis represents elapsed time since the run starts. A step's bar is positioned and sized by when it starts and how long it runs. This lets you determine which steps run sequentially and which overlap. Because every run in the session shares the same axis, you can also compare separate runs against each other at a glance. In Tokens view, there is no time axis: bars are left-aligned and sized in proportion to each step's token count.
The following image shows a session's runs timeline while a run is in progress:
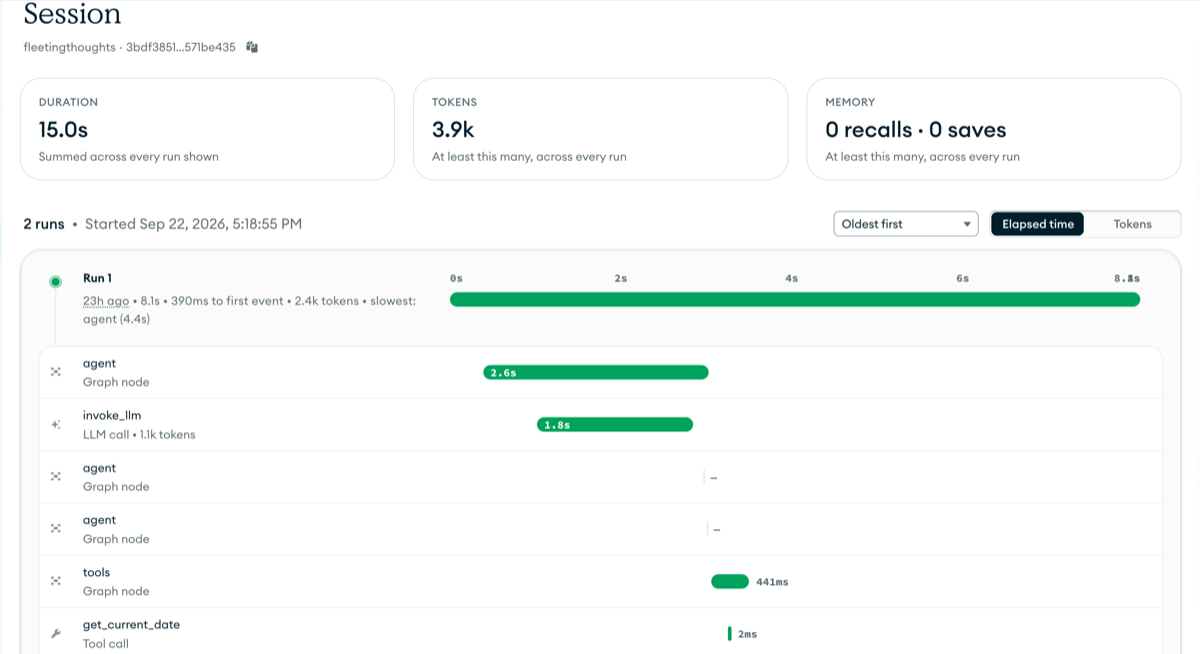
Each run's header reports its relative start time, total duration, time to first event, total tokens, and the slowest step it contains, in the form slowest: <step> (<duration>).
An in-progress run shows a stop control. Stopping a run changes its status to Stopping… and then to Stopped once it halts. Cancellation isn't always instantaneous because a step may need to finish its current operation first. The interrupted step shows a matching Stopped badge, identifying exactly which step the stop interrupted.
Each step row shows an icon and a name. Depending on the step's state, it shows either a duration or a state label. A completed step shows its duration, and an LLM call also shows its token count. A step still in progress shows Running….
Select a step to open its details in a side panel, including its kind, status, duration, and who invoked the run. The panel also shows the step's inputs and outputs, such as the messages sent to and returned from a model call.
Find the Cause of a Slow Run
When a run takes longer than expected, use the following signals to find the specific step responsible:
Start with the run header's slowest step callout, in the form
slowest: <step> (<duration>). Select that step to inspect its details directly.If the run was slow to start rather than slow to finish, check time to first event instead of the slowest step. A consistently high value across runs means the delay happens before any step you can inspect even starts.
If a run's total token count is high but no single step stands out in the Elapsed time view, switch to the Tokens view. A step can be a token bottleneck without being the slowest step by wall-clock time.
If a run's total duration is high but its steps all look fast, check whether the run waited on a human review. If it did, the run header replaces its duration and time-to-first-event fields with an
active/reviewsplit, such as "2min 3s active - 1h 30min review". High review time means the run was paused in the human-in-the-loop review queue, not actually running slowly. To learn more, see Human-in-the-Loop Agent Execution.
Next Steps
To learn more about monitoring and invoking your agent, see the following guides: