Monitor grid topology, forecast demand with weather data, analyze customers, and query it all through a grid support agent on MongoDB Atlas.
Use cases: Intelligent Search, IoT
Industries: Manufacturing & Mobility, Energy Management
Products and tools: MongoDB Atlas, MongoDB Vector Search, MongoDB Time Series Collections, Voyage AI by MongoDB
Partners: Anthropic, LangChain
Solution Overview
Utility companies collect high-frequency smart meter data at scale, yet teams often still manage monitoring, forecasting, customer analysis, and AI workflows in separate systems.
That fragmentation creates duplicated data pipelines, slower decisions, and higher operating costs.
The Smart Grid Intelligent Platform shows how you can run those workloads on MongoDB Atlas by using one operational data layer for real-time monitoring, network operations, demand forecasting, customer intelligence, and a grid support agent.
Use this solution to:
Monitor the grid in real time: detect outages, track power factor, and flag anomalies (voltage spikes, unusual consumption) directly in the database.
Operate the network: visualize the grid topology (utility → substation → feeder → transformer), score substation health, and surface peak-load warnings and outage risk from live capacity utilization.
Forecast demand with weather: project expected demand and peak timing per region, enriched with external weather data (heating and cooling degree days), to plan capacity and prevent overloads.
Understand customers: surface tariff recommendations, consumption trends, appliance-level breakdowns, and usage segments from the same meter data.
Act through natural language: query the grid, the network, the knowledge base, and customer data through a grid support agent.
MongoDB Atlas supports this design with built-in capabilities for time series data, flexible data modeling, in-database processing, and AI-powered retrieval:
MongoDB Atlas Time Series: native time series collections store high-frequency meter readings efficiently and power fast temporal queries.
Aggregation Framework: analytics run in the database, not the app, gaps-and-islands outage detection with
$setWindowFields, anomaly and demand statistics with$groupand$stdDevSamp, and feeder/substation utilization measured against each asset's rated capacity. The high-frequency reads (demand, forecasting) run as a single-collection scan over readings that already carry their grid context.Flexible document model: meters, customers, and the grid network hierarchy live as related documents, joined on demand, no rigid schema to migrate as the network evolves.
Atlas Vector Search with automated Voyage AI embeddings: semantic search over a domain knowledge base with no separate embedding service to operate. See Voyage AI
Hybrid search: vector and full-text results fused with Reciprocal Rank Fusion (RRF) for more relevant retrieval.
Agentic AI on MongoDB: a LangGraph multi-agent assistant with per-domain skills and conversation memory persisted in Atlas, so context is stored alongside the operational data, no external state store.
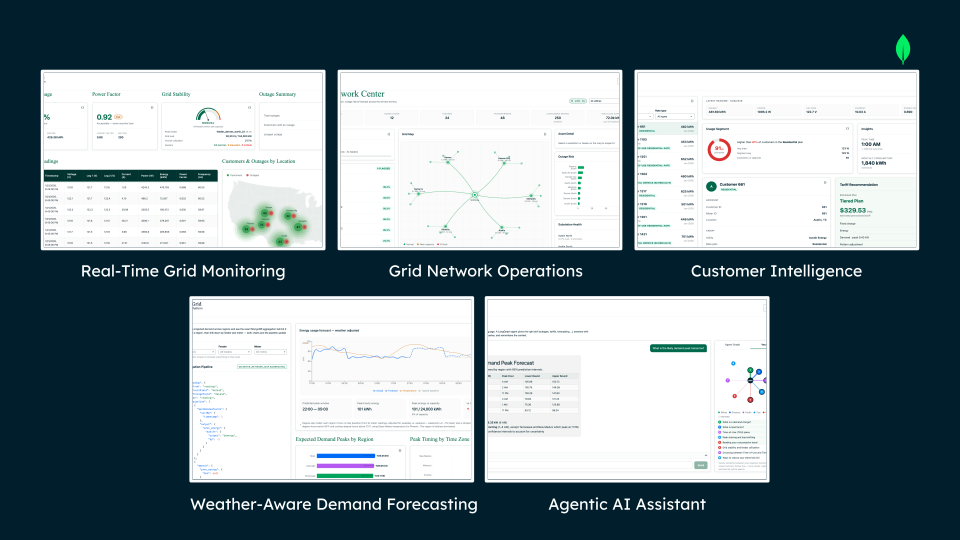
Figure 1. Smart Grid Intelligent Platform main features
Reference Architectures
The platform combines the following layers on a single MongoDB Atlas cluster:
An operational data layer that powers the monitoring, network, forecasting, and customer views.
An agentic AI layer that lets users query it all in natural language.
Both read from the same documents, so you don’t need separate systems to copy or synchronize information.
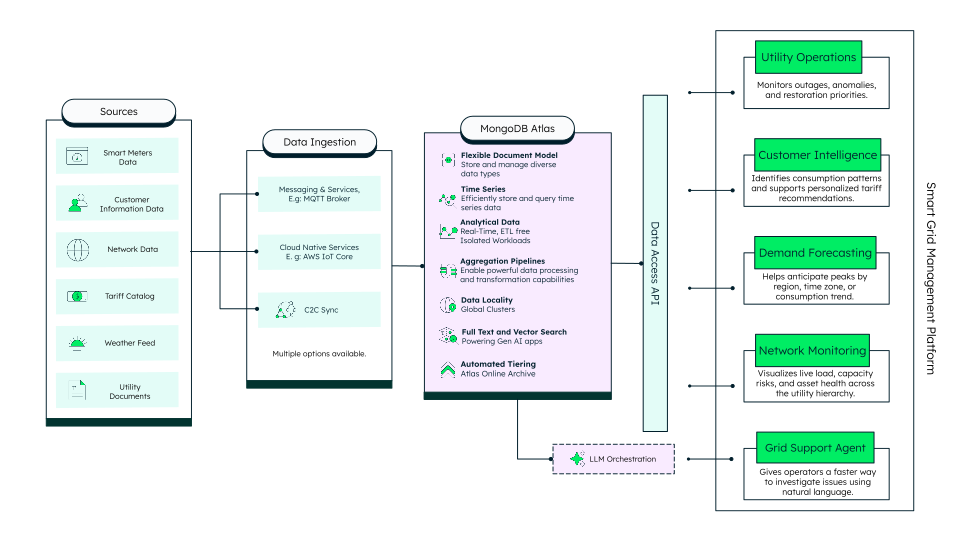
Figure 2. High level Smart Grid Architecture - Operational Data Layer
Operational Data Layer
Smart-grid readings land in a time series collection, the Aggregation Framework computes analytics in the database, and the results power the monitoring, network, forecasting, and customer views.
This is how data flows through the architecture:
Ingestion (Time Series): High-frequency smart-meter readings (voltage, current, power, energy, power factor, and appliance-level sub-loads) are stored in the
readingsAtlas Time Series collection, optimized for fast temporal queries at scale.Grid topology model: The grid hierarchy (utility → substation → feeder → transformer, with capacities) lives in the
networkcollection, andmeter_network_maplinks each meter to its feeder. Because the model is flexible, the topology can evolve without schema migrations.In-database processing (Aggregation Framework): Each view is powered by an aggregation pipeline that runs where the data lives:
Monitoring: outage detection with
$setWindowFieldsand$shift(gaps-and-islands), per-meter anomaly detection with$stdDevSamp(N-sigma), and power-factor tracking.Network Center: sums each feeder's live load and compares it against the asset's rated capacity_kw to compute utilization, then derives substation health scores, peak-load warnings, and outage risk across the utility → substation → feeder → transformer hierarchy.
Forecasting: expected demand and its prediction interval per region/hour with
$group+$avgand$stdDevSamp, projected forward by a seasonal model (hour-of-day and day-of-week) and enriched with external weather (heating/cooling degree days), plus a peak-timing view.Customers: tariff recommendations against
tariff_catalog, plus insights, appliance breakdowns, usage segments, and consumption trends.
External enrichment: The forecasting workload calls the Open-Meteo weather API for hourly temperatures by region, which the pipeline turns into degree-day features so demand forecasts reflect real weather conditions.
Presentation: A Next.js (App Router) application exposes each pipeline through API routes and renders the results as live dashboards. Every card includes a "Show document" view that reveals the underlying documents and the exact aggregation pipeline behind it.
Why this matters: monitoring, network operations, forecasting, and customer intelligence all read from the same operational documents. The Aggregation Framework replaces a separate analytics engine, and the flexible document model keeps meters, customers, and the evolving grid hierarchy together, so the platform scales without copying or reconciling data across systems.
Agentic AI Layer
A user's natural-language question flows through a LangGraph multi-agent orchestrator that reasons over the question, calls the right tools, retrieves data from MongoDB, and returns a grounded answer. All while its conversation memory and search data live in the same Atlas cluster.
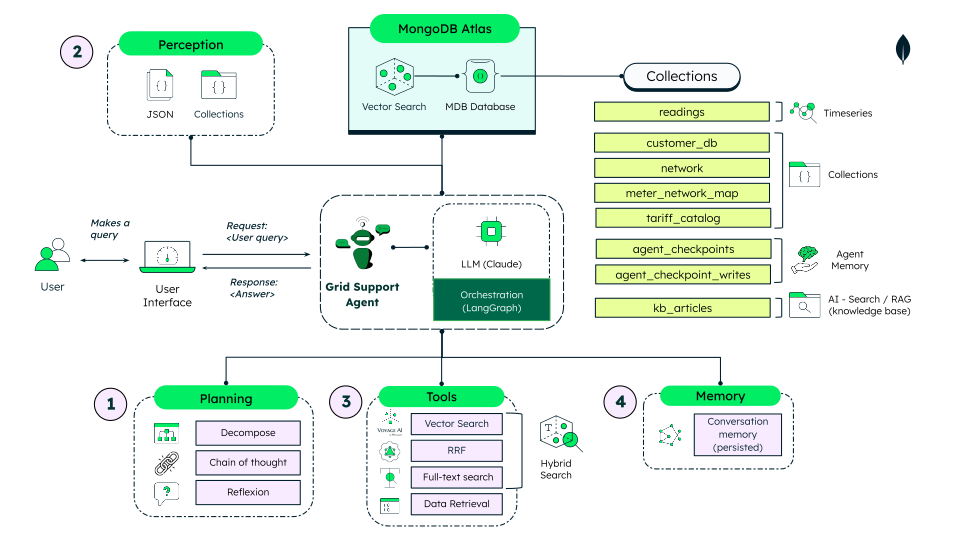
Figure 3. High level LLM Orchestration - Agentic AI Layer
This is how a query flows through the architecture:
User query (Interface): A user asks a question in natural language from the grid support agent. The interface sends the request (Request:
<user query>) to the agent and later renders the response (Response:<answer>).Perception: The agent perceives its world as MongoDB documents, the user query plus the operational data stored as JSON across the platform's collections. This is the context the agent reasons over.
Planning: The LangGraph orchestrator interprets the request, routes it to the right domain workflow, calls the required tools, and returns a grounded answer.
Tools: The agent executes the selected tools:
Hybrid search (RAG) over the knowledge base: Vector Search (semantic) and full-text search (keyword) fused with Reciprocal Rank Fusion (RRF) for the most relevant passages.
Data Retrieval: MongoDB aggregations over the operational collections (grid, network, customers, tariffs) to answer with live data.
Memory: Conversation state is persisted in MongoDB Atlas (
agent_checkpoints,agent_checkpoint_writes), so the agent remembers context across turns without an external state store.Reasoning and generation (Orchestration): The LangGraph orchestration layer coordinates the loop, and the LLM (Claude) reasons over the retrieved context and synthesizes the final answer, which is returned to the user.
Bringing it together: the AI layer doesn't duplicate logic, its Data Retrieval tools call the same aggregations that power the operational dashboards, and both layers share one Atlas cluster for data, search, and agent memory.
Data Model Approach
This solution runs monitoring, network operations, forecasting, customer intelligence, and a grid support agent on a single MongoDB Atlas data layer.
The MongoDB document model makes that possible by organizing operational, search, and memory data into flexible collections that stay connected without requiring separate systems to store, sync, or reconcile information.
This solution is built on a set of MongoDB collections that work together to support both operational workloads and AI capabilities:
readingsstores time series meter data.customer_db,network,meter_network_map, andtariff_catalogstore the core customer, grid, mapping, and tariff data.agent_checkpointsandagent_checkpoint_writespersist agent memory.kb_articlespowers AI search over the knowledge base.
Together, these collections provide one connected data layer for monitoring, analysis, and intelligent user interactions. The following sections describe each collection in more detail and explain how its structure supports the overall solution
readings: Stores one meter reading per interval, electrical measurements, appliance-level sub-loads, precomputed interval consumption (interval_kwh), and its denormalized grid context (feeder/substation/utility), in a time series collection.
{ "timestamp": { "$date": "2026-07-08T17:00:00.000Z" }, "dataid": 661, "power_factor": 0.933, "city": "Austin", "frequency": 60.043, "voltage": 119.958, "energy": 53.76054, "feeder_id": "feeder_austin_south_02", "kitchen_power": 168.8, "power": 3246.151, "env_power": 1112.159, "heating_power": 344.741, "utility_id": "utility_austin", "laundry_power": 61.352, "current": 29.004, "_id": { "$oid": "6a760c8ee48b9c05164d7d57" }, "avg_reading": 119.958, "interval_kwh": 0.81154, "ev_power": 0, "volt_leg_1": 118.982, "has_ev": true, "transformer_id": "transformer_austin_south_02_01", "hvac_power": 1559.099, "substation_id": "substation_austin_south", "volt_leg_2": 120.934, "state": "Texas" }
network: Models the utility hierarchy as linked documents.parent_asset_idforms the utility → substation → feeder → transformer hierarchy, and each asset carries its own capacity and location.
{ "_id": { "$oid": "6a43f5a0fc0d1c3b5276bb29" }, "asset_id": "transformer_austin_south_02_02", "asset_type": "transformer", "city": "Austin", "state": "TX", "name": "Austin South Transformer 02-02", "parent_asset_id": "feeder_austin_south_02", "capacity_kw": 1500, "voltage_kv": 0.48, "status": "active", "location": { "type": "Point", "coordinates": [ -97.7131, 30.263199999999998 ] } }
tariff_catalog: Stores rate plans with their tier bands embedded as an array, so a full plan reads as one document.
{ "_id": { "$oid": "6a760c89e48b9c05164d7d4c" }, "utilityName": "Austin Energy", "rateName": "Residential", "fixedChargeFirstMeter": 15, "fixedChargeUnits": "$/month", "energyRateStrux": [ { "energyRateTiers": [ { "max": 300, "unit": "kWh", "rate": 0.04106, "adj": 0.06455 }, { "max": 900, "unit": "kWh", "rate": 0.05138, "adj": 0.06455 }, { "max": 2000, "unit": "kWh", "rate": 0.07525, "adj": 0.06455 }, { "unit": "kWh", "rate": 0.10884, "adj": 0.06455 } ] } ], "energyWeekdaySched": [... ], "energyWeekendSched": [... ], "effectiveDate": { "$date": "2025-05-01T00:00:00.000Z" }, "sourceReference": "https://austinenergy.com/-/media/project/websites/shared/pdfs/rates/tariff.pdf?rev=382867d1201343b78d6a940e4ef471b5&hash=51DA5A20032359FB44C3F61BFB5E7F5E", "rate_type": "tiered", "city": "Austin", "state": "TX", "location_label": "Austin, TX" }
kb_articles: Stores the domain knowledge base, indexed for Atlas Vector Search (with automated Voyage AI embeddings) and full-text search. Embeddings are generated by Atlas from the text field with no separate embedding pipeline.
{ "_id": { "$oid": "6a711e3759c1cc549f2e8c42" }, "slug": "what-is-power-factor", "category": "Glossary", "text": "Power factor is the ratio of real power (kW, the power that does useful work) to apparent power (kVA, the total power drawn). It ranges from 0 to 1. A power factor near 1.0 means electricity is being used efficiently; a low power factor (for example below 0.9) means a lot of reactive power is being drawn, which stresses the grid and can incur penalties for commercial customers. Motors, transformers, and other inductive loads lower the power factor.", "title": "What is power factor?", "updatedAt": { "$date": "2026-08-04T19:30:01.654Z" } }
meter_network_map: Maps each meter (dataid) to its place in the grid topology (feeder, substation, utility, and transformer). That same context is also denormalized onto each reading, so the high-frequency views read it without a join.customer_db: Stores each customer's location (city and state), keyed by meterdataid. The rate plan and usage segment are derived on demand (fromtariff_catalogand by aggregation).agent_checkpointsandagent_checkpoint_writes: stores agent memory, managed by LangGraph, where the assistant's conversation state is persisted by thread so context survives across turns, no external state store.
Why the document model fits this solution:
Each reading carries everything about that moment: A meter reading embeds its electrical measurements and its appliance-level sub-loads in one document, no joins to reconstruct a single reading. Stored in a Time Series collection, these ingest and query efficiently at high frequency.
The grid hierarchy is modeled as it exists: The network (utility → substation → feeder → transformer) is stored as linked documents the platform walks to assemble topology views, and each reading carries its place in that hierarchy, so the model can grow or change without schema migrations.
The schema evolves without migrations: New appliance sub-loads, customer attributes, or asset fields can be added as new fields, so existing documents, pipelines, and application workflows keep working as the platform expands.
The same data supports every workload: The aggregations behind monitoring, forecasting, and customer dashboards all run on the same operational collections that support joins across the grid model, which reduces duplication and avoids separate systems.
AI data lives with operational data: The knowledge base, vector and full-text search, and the agent's conversation memory all live in the same MongoDB Atlas cluster, so retrieval, reasoning context, and operational analysis work together without separate infrastructure.
Build the Solution
The Smart Grid Intelligent Platform uses MongoDB Atlas as a single data layer for real-time monitoring, network operations, demand forecasting, customer intelligence, and a grid support agent.
Follow these high-level steps to deploy the solution. For detailed setup instructions, sample data, and runnable code, see the GitHub repository.
Set up your environment.
Install the prerequisites (Node.js for the Next.js frontend, Python with uv for the backend).
Create a MongoDB Atlas cluster (M10 or higher, required for Atlas Vector Search with automated embeddings).
Obtain a Voyage AI API key and an Anthropic API key (the grid support agent uses Claude).
Configure environment variables for the MongoDB connection URI, database and collection names, and the API credentials.
Deploy your application.
Start the Next.js frontend.
Enable the real-time monitoring, network, forecasting, and customer dashboards, each powered by MongoDB aggregation pipelines.
Enable the grid support agent (LangGraph orchestration, hybrid search, and conversation memory persisted in Atlas).
Explore the platform at http://localhost:3000.
Key Learnings
Consolidate operations on a single data platform: Run monitoring, network operations, forecasting, and customer intelligence on one MongoDB Atlas cluster removes the cost and delay of copying and reconciling meter data across separate systems. This approach lowers total cost of ownership and gets new capabilities to production faster.
Turn raw meter data into operational decisions: Compute outages, capacity utilization, and anomalies directly in aggregation pipelines so operators can act on grid conditions in real time. This reduces downtime and prevents overloads before they cascade into failures.
Plan capacity with weather-aware forecasting: Enrich demand forecasts with external weather data (including heating and cooling degree days) to help utilities anticipate peaks and allocate capacity proactively. This reduces costly emergency response and improves grid reliability.
Improve customer outcomes with unified intelligence: Serve tariff recommendations, consumption trends, and usage segments from the same meter data to help utilities engage customers with relevant, personalized guidance. This supports satisfaction and retention.
Empower teams with agentic AI on MongoDB: Use a LangGraph multi-agent assistant to let any operator query the grid, network, and customers in natural language. This democratizes access to data and speeds up decisions without waiting on specialized reports or analysts.
Authors
Muhammad Atif
Andrea Fatima Figueroa Lopez
Maria José Cordova Igartua
Javier Guajardo Canseco
Andrea Alaman Calderon