Modern applications generate more telemetry than ever before, yet one of the most critical systems in production often remains disconnected from the rest of the observability stack: the database. When incidents occur, operators shouldn’t have to jump between dashboards, stitch together signals from disconnected systems, or rely on brittle integrations just to understand what’s happening. Database telemetry should be part of the same operational picture as application and infrastructure telemetry.
Now, MongoDB is closing that gap.
MongoDB Atlas is introducing OpenTelemetry (OTel) Metrics Sink, a push-based OpenTelemetry metrics stream that enables organizations to deliver high-fidelity Atlas metrics directly to OpenTelemetry-compatible observability platforms with minimal configuration. Database telemetry now flows alongside application and infrastructure metrics, giving teams a unified operational view using the tools they already rely on. This further strengthens MongoDB Atlas’s integration with the modern observability ecosystem.
Observability has evolved. Database monitoring needs to evolve, too.
Enterprise observability has fundamentally changed. More organizations are consolidating application, infrastructure, and database telemetry into centralized observability platforms to simplify operations and gain a unified view of system health. At the same time, OpenTelemetry has emerged as the leading open standard for collecting and transporting telemetry across modern software stacks. Together, these trends are helping engineering teams reduce operational complexity, improve interoperability, and accelerate incident response.
Atlas Observability with OTel Metrics Sink helps close that gap. Rather than forcing operators to swivel between MongoDB Atlas and third-party monitoring platforms, Atlas now streams metrics directly into existing observability workflows using an open, vendor-neutral standard. No custom exporters. No polling infrastructure. No fragmented operational workflows.
MongoDB Atlas metrics, wherever your operations happen
The OTel Metrics Sink provides organizations with a simpler way to deliver Atlas metrics to OTLP-compatible observability backends. Atlas handles the formatting and delivery, allowing teams to integrate database telemetry alongside application and infrastructure metrics without maintaining custom collection pipelines.
That means teams can benefit from:
- Unified visibility: View MongoDB Atlas metrics alongside infrastructure and application telemetry to understand database behavior within the broader production environment.
- Less operational overhead: Push-based delivery eliminates the complexity of pull-based collection, reducing reliance on custom integrations and avoiding common challenges such as API rate limits and additional network configuration.
- Greater flexibility: By embracing OpenTelemetry, Atlas enables organizations to adopt a more open, vendor-neutral observability strategy that works with the platforms they already use.
- Faster incident response: Bringing database metrics into a centralized observability platform gives operators the context they need to diagnose issues more quickly and resolve incidents faster.
Built for modern operations
For DevOps engineers and site reliability engineers (SREs), the value is immediate: less time maintaining telemetry pipelines, fewer dashboards to navigate, and faster access to the metrics that matter most during an incident.
Platform teams and enterprise architects benefit as well. By embracing OpenTelemetry, MongoDB Atlas supports standardized telemetry architectures, reduces operational costs associated with maintaining custom integrations, and integrates seamlessly into enterprise observability strategies built on open standards. But metrics are only part of the observability story.
OTel Metrics Sink builds on the momentum of Atlas Log Integration, now generally available, which enables organizations to export MongoDB logs—including mongod and audit logs—to third-party observability platforms, OpenTelemetry Collectors, and cloud object storage. Soon, Atlas Events Integration will extend that same model to Atlas Activity Feed events, making it easier for teams to route MongoDB Atlas administrative and configuration events into the observability and security tools they already use.
Together, metrics and logs deliver a more complete view of database health and performance. And with Atlas Events Integration coming soon, MongoDB Atlas is further expanding the observability story to include control-plane activity alongside data-plane telemetry.
Metrics help teams detect issues before they become outages. Logs provide the context needed to understand what happened and accelerate root cause analysis. Events help teams understand the Atlas administrative and configuration activity happening around those systems. Combined within a centralized observability platform, these signals give teams a richer understanding of application health, database performance, and operational risk.
Instead of treating database telemetry as an isolated signal, MongoDB Atlas brings it into the same operational workflows organizations already rely on across their technology stack.
Simple to deploy. Built to scale.
Observability tooling should reduce operational complexity, not create more of it. OTel Metrics Sink is designed for quick adoption, with straightforward endpoint configuration through both the Atlas UI and Terraform. Organizations can configure multiple OTLP endpoints, making it easy to integrate MongoDB Atlas telemetry into existing environments without introducing additional operational overhead.
By moving away from one-off, vendor-specific exporters and toward a standards-based integration model, teams can spend less time managing telemetry infrastructure and more time acting on operational insights.
This metric integration is available for dedicated M10+ clusters. An external sink can be configured in minutes:
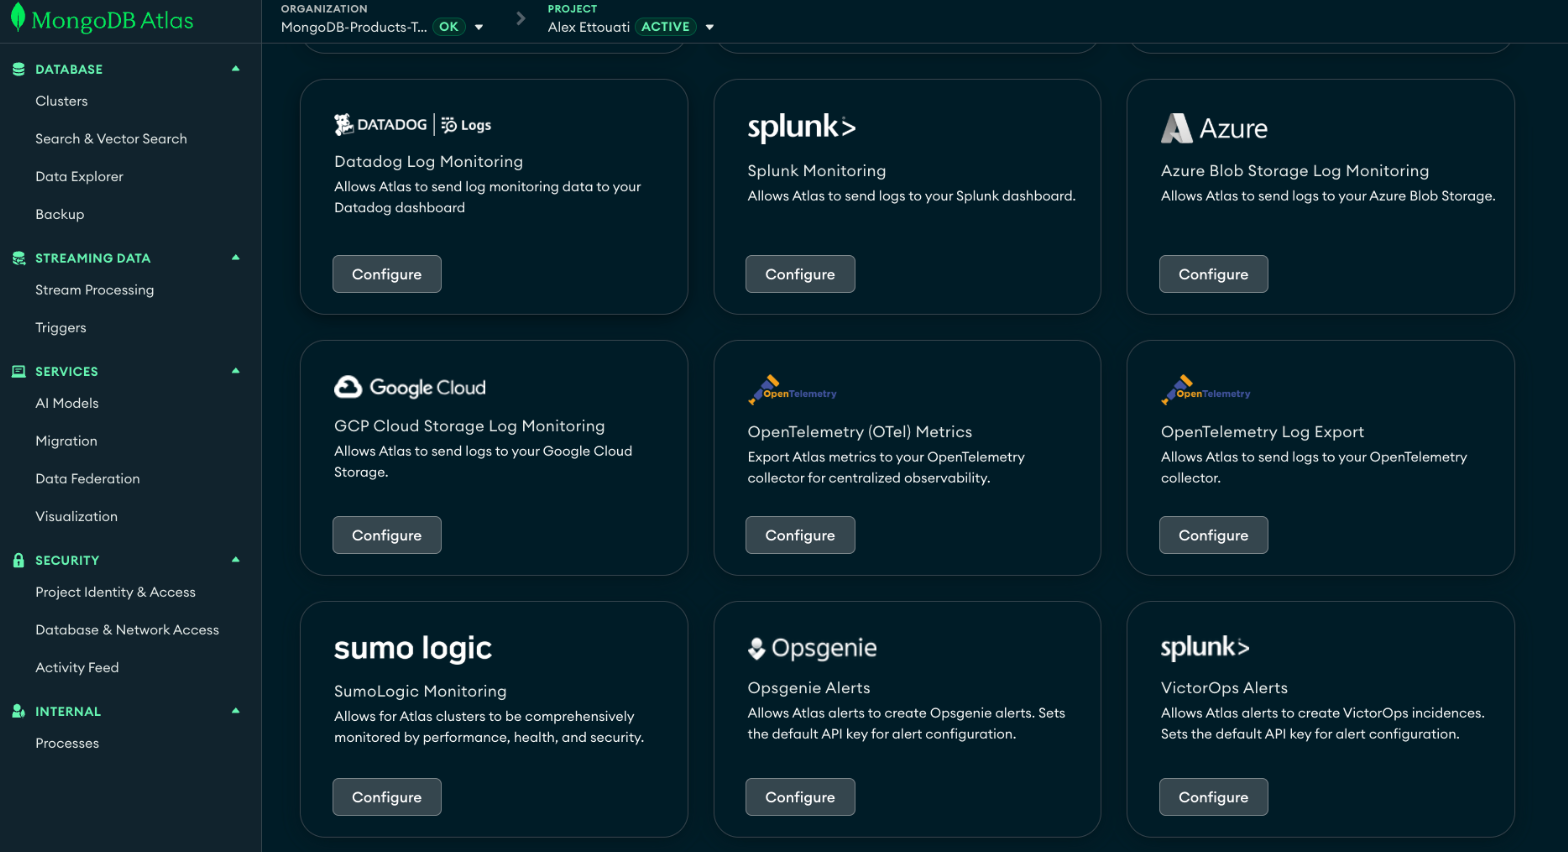
- Navigate to the Project Integrations page in the Atlas UI.
- Select OpenTelemetry and choose the intended integration type or destination.
- Enter the required connection details and credentials for the destination:
- For a custom OTel destination, provide an OTLP endpoint,
- For Dynatrace, provide a Dynatrace API token and Environment ID,
- For New Relic, provide a New Relic API key.
- Ensure the destination is reachable on a public IP address, and allow inbound traffic from the relevant Atlas outbound IP addresses for your provider and region.
- Save or test the integration. MongoDB Atlas emits a test metric when the integration is created, updated, or tested to verify it is working.
Figure 1. Atlas Integration configuration options for delivering MongoDB metrics to observability platforms.
Building the future of MongoDB Atlas observability
OTel Metrics Sink establishes the foundation for the next generation of Atlas observability. As enterprises continue to standardize on OpenTelemetry, MongoDB is investing in richer telemetry, deeper operational insights, and a more connected observability experience. The database has always been one of the most critical layers of the modern application stack. Its telemetry should be just as accessible as every other signal.
With the OTel Metrics Sink, MongoDB makes it simple to send Atlas metrics into the platforms organizations already trust. Combined with Atlas Log Integration, teams can centralize database telemetry alongside application and infrastructure signals, accelerate troubleshooting, and reduce operational complexity. And with Atlas Events Integration coming soon, Atlas will help teams bring Activity Feed events into those same workflows.
Modern observability is built on open standards. MongoDB Atlas ensures your database is part of that future.
Next Steps
Ready to bring Atlas telemetry into your existing observability workflows? Explore the Atlas OpenTelemetry integration documentation and configure your first metrics endpoint through the Atlas UI or Terraform.