In high-stakes enterprise environments, outages do not wait for business hours, and neither do IT/Network Operators.
A latency spike hits the dashboard, and metrics signal that the database is under pressure. The cause? Indeterminate. Meanwhile, the business impact is immediate: orders fail to process, customers can’t access accounts, transactions stall, and critical records become temporarily unavailable. Every minute of uncertainty translates into lost revenue, frustrated users, and escalating pressure.
Teams often fall back on a familiar—yet time-consuming—ritual: logging into their data platform, exporting large log files, extracting compressed archives, and manually searching through thousands of lines of entries to identify the issue. What should be a quick diagnosis becomes a manual context-switching investigation. By the time the problematic query, configuration issue, or audit event is identified, users have already experienced the disruption—and the business has absorbed the cost.
MongoDB believes the database should be the heartbeat of a digital business. So we’re introducing a new log integration that brings MongoDB Atlas system and audit logs directly into external observability and storage platforms. This enhancement helps bridge the gap between metrics and meaning when it matters most.
Flexible log delivery for modern observability workflows
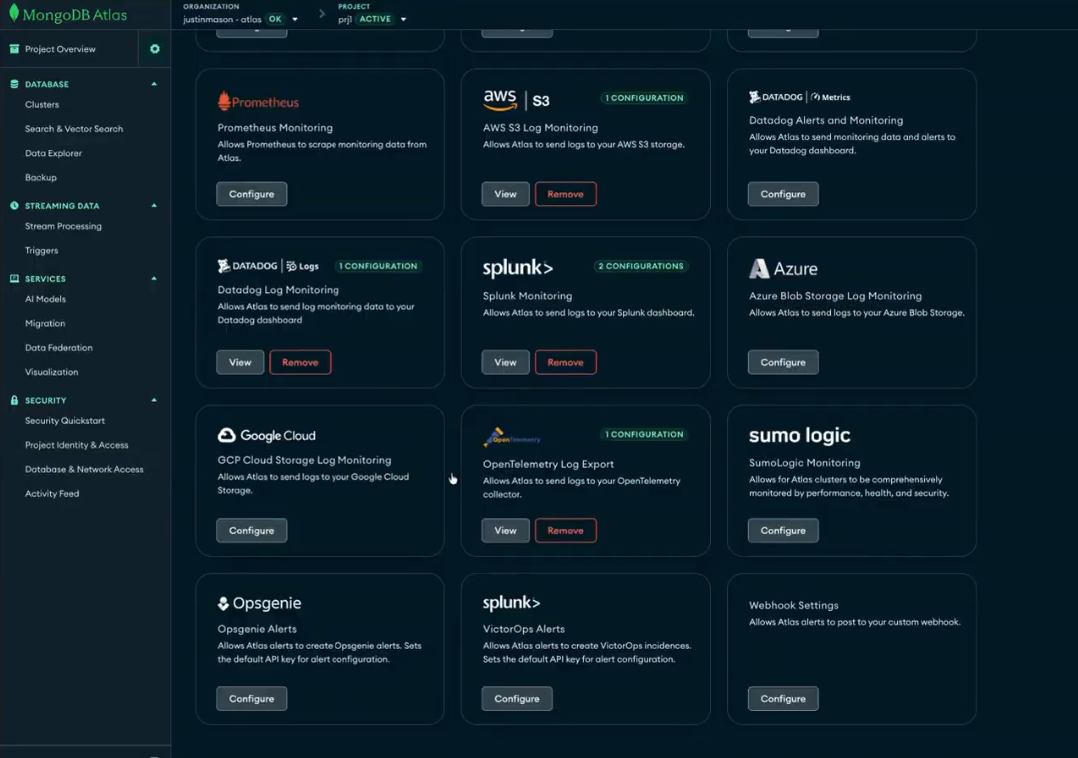
Now database operators, DevOps pros, and IT Operations teams alike can send MongoDB system and audit logs—including mongod, mongos, and audit logs—directly to the tools they already rely on: Datadog, Splunk, Google Cloud Storage, Azure Blob Storage, or Amazon S3.
Beyond native integrations, MongoDB supports sending logs via OpenTelemetry (OTel), the open-source standard for collecting and transmitting telemetry data. This enables customers to export MongoDB logs to any observability or logging backend that supports OTel. By using a vendor-neutral, standards-based protocol, MongoDB fits seamlessly into modern observability architectures. This eliminates lock-in and preserves flexibility as tooling strategies evolve.
Enabling real-time clarity
Modern enterprises generate rich system logs essential for debugging and compliance. However, when these logs are siloed, operational inefficiencies grow. Manual log access introduces friction, delays resolution, and creates a visibility gap between metrics and logs.
MongoDB’s new log integration transforms that experience with:
Accelerated troubleshooting: Send logs in near real-time to observability platforms like Datadog, Splunk, or OpenTelemetry-compatible backends, enabling teams to quickly identify issues and reduce manual operational steps that slow incident resolution.
Unified telemetry: Correlate MongoDB logs with application traces and infrastructure metrics in existing observability platforms, helping teams quickly understand how database behavior impacts overall system performance.
Simplified compliance: Automatically route audit logs to secure long-term storage such as Amazon S3, helping organizations meet regulatory and audit requirements without manual log management.
Figure 1. Atlas Log Integration configuration options for delivering MongoDB logs to observability and storage platforms.
Real-world use cases
How does this look in practice for modern application, operations, and engineering teams? Here are a few examples.
The criticality of observability
As applications scale, the database becomes the most critical layer of an organization’s technology stack. Missing or siloed visibility leads to costly downtime and fragmented decision-making.
This log integration is available for dedicated M10+ clusters. An external sink can be configured in minutes:
Navigate to the Project Integrations page in the MongoDB Atlas UI.
Select the intended destination: Datadog, Splunk, Google Cloud, Microsoft Azure, Amazon S3, or any OTel log endpoint.
Enter the required credentials and select the desired logs to send: mongod, mongos, or audit.
Note: Atlas Search logs are also currently available via private preview.
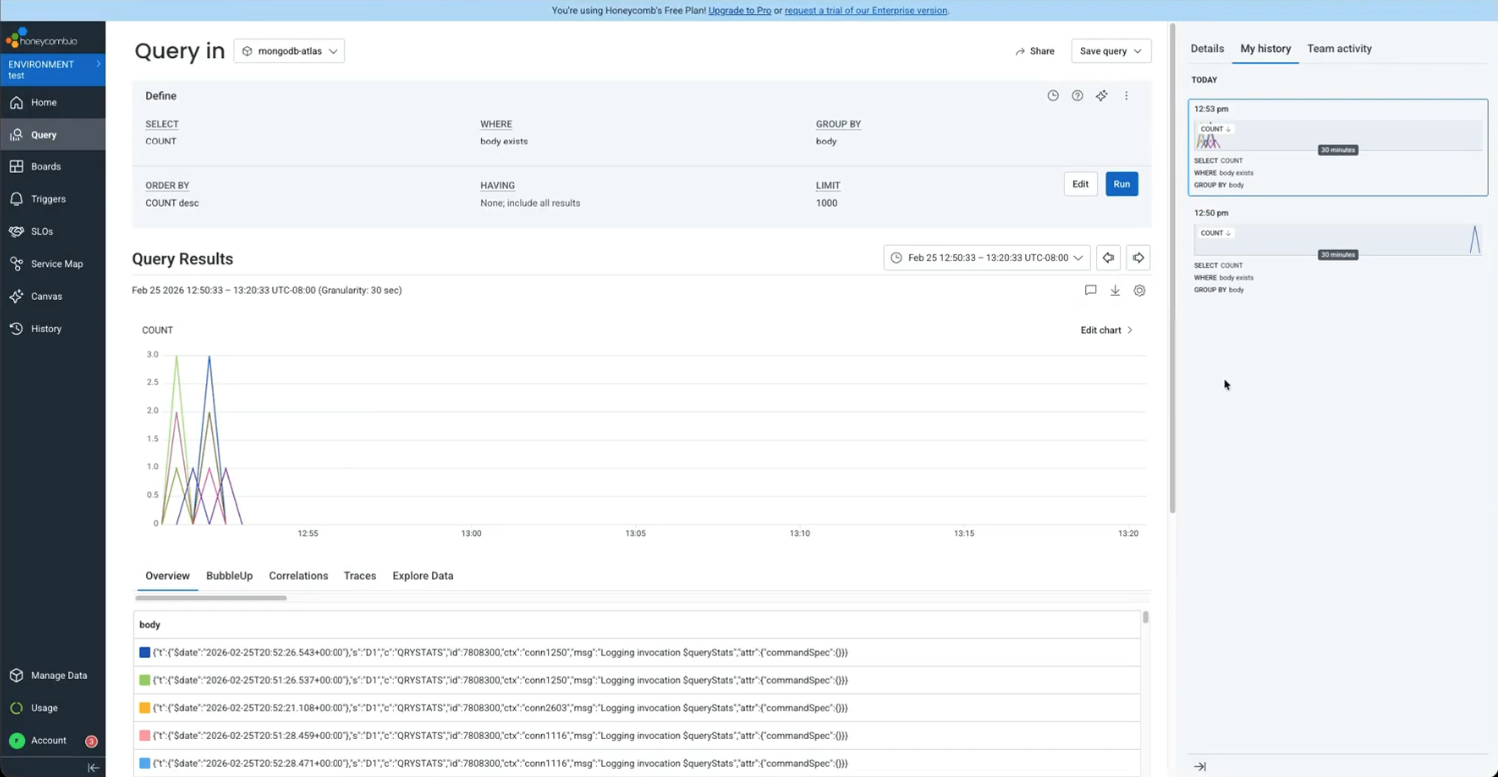
Figure 2. MongoDB Atlas logs integrated into an OpenTelemetry observability pipeline.
One observability strategy, built to scale
For teams that need fast, MongoDB-centric visibility, MongoDB Atlas continues to offer powerful native tools like Query Insights and the Query Profiler. These capabilities are designed to surface what is happening inside a user’s clusters with minimal friction.
However, as organizations scale, database insights can not live in isolation. MongoDB Atlas’s log integration extends observability systematically to the data plane. This enables MongoDB logs to flow into the observability platforms teams already use across engineering, security, IT operations, and compliance. With native integrations and an OpenTelemetry-compatible endpoint, teams can route logs wherever they are needed. This enables rapid troubleshooting, stronger auditability, and confident scaling without blind spots.
Next Steps
Ready to eliminate the blind spots? Log in to MongoDB Atlas to configure your first log integration, or explore our documentation for Terraform setup.