Data is our present and our future. Time series data, specifically, can be incredibly revealing. This sort of data mining allows you to gather and compare one or more variables at regular intervals. This means you can perform exploratory analysis and create predictive modeling to take past data pattern recognition and use it to get a glimpse into the future. But what is time series data, exactly? How can it be visualized? What are some common examples, and how can you better store and query time series data? Let's dive in!
Table of contents
- What is time series data?
- Visualizing time series data
- Time series data examples
- Time series data key characteristics
- Time series data use cases
- How to store and query time series data
- Time series analysis with MongoDB
- Conclusion
- FAQs
What is time series data?
Time series data is a collection of data points that are registered at regular intervals. Each data point is a key-value pair. The key is a point in time, and the value is the observation at that time. In practice, the value can be a collection of observations instead of a single chosen data point. For example, a sensor can report both the temperature and the wind pressure at the current time.
What's the benefit of this type of data?
Why is time series data useful? Time series analysis is a technique for extracting meaningful characteristics from pooled data. Time series forecasting models use different statistical models to predict a future value. This allows organizations to understand trends in data over time, extract meaningful statistics, and better analyze data, thus helping them to make smarter decisions.
Visualizing time series data
The most straightforward way to analyze time series data is by plotting it and observing the characteristics of the data collected. Run charts are line charts that show the data points as a function of time. The x-axis is the time, and the y-axis is the observed value.
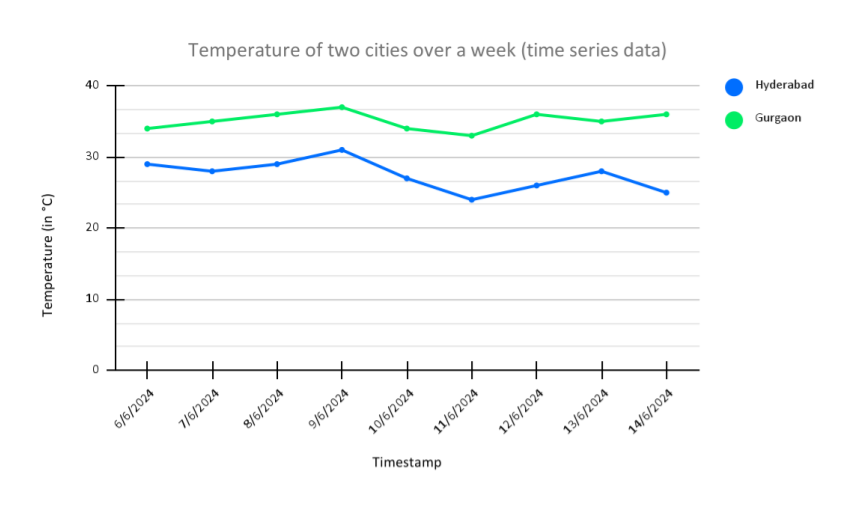
The above is an example of simple time-series data, where the temperature of two cities over one week is recorded and plotted as line charts. From the chart, we can see that the temperature of each city has remained more or less the same throughout the week, and out of the two cities, Gurgaon has a higher temperature.
For our further examples of time forecasting methods, we'll be storing the data in a time series collection on a MongoDB Atlas instance. We're plotting it with MongoDB Charts to better understand the historical data and set us up for better trend analysis.
Time series data examples
Time series data can be found in a variety of industries — from financial markets to sports to climate change. Let's see some examples of time series data and time series analysis as advanced techniques of forecasting methods.
Financial time series data
Time series data is essential to financial markets and stock market analysis. The market is a system with complex behavior, and forecasting and collecting data from it can be a hard task. Various models and algorithms can be used to forecast such systems and conduct trend analysis — a linear model, non-linear, neural networks, etc. Stock prices change over time. The price can be recorded over time. The recorded time series data can be analyzed to find trends and predict future activity. The following chart visualizes time series data of the closing price of a stock.
The x-axis is the week of the year, and the y-axis is the average closing price of the stock for that week. The time series data source is a collection of documents, each document representing the stock price on a given day.
Using statistics to forecast stock prices
Financial data and stock prices are analyzed and forecasted with statistics called indicators. Common technical time series analysis indicators include the relative strength index (RSI) and the moving average convergence-divergence indicator (MACD). We'll talk more about the moving average in a minute.
You can easily calculate and visualize RSI, MACD, and other indicators using window functions. Window functions perform operations on a span of documents in the collection (a “window”).
For example, you can get the first three observations in the same period and calculate their average. Then, you calculate the average of the second, third, and fourth observations.
After repeating the process for all observations in the period, you're going to have a list of averages, also known as a moving average model. Moving average is another financial indicator used for “smoothing out” price data (also called the exponential smoothing technique).
To learn more about calculating indicators with the help of window functions, check out our tutorial series, Currency Analysis With Time Series Collections.
Sports time series data
Sports are another great source of time series data and time series analysis. For example, the number of people attending a sports game can be recorded over time. The recorded time series data can be analyzed to find trends and correlate with other data.
But there's one sport where the scientific and objective time series analysis of the game is so important that it has its own name. Sabermetrics is the analytical time series analysis of the game of baseball.
In the critically acclaimed Hollywood film Moneyball, the Oakland Athletics baseball team uses sophisticated sabermetrics models for scouting and analyzing baseball players. The film showcases the importance of collecting data and time series analysis for modern sports teams.
Visualizing attendees per game
Sabermetrics and scouting sports talent are broad topics that are quite beyond the scope of this article. Instead, let's take a look at a much simpler example. Coincidentally, we'll be looking at data points recorded from the Oakland Athletics' rival in the Bay Bridge Series — the San Francisco Giants. The following chart visualizes the time series analysis of attendees per game. We can observe that the number of attendees is increasing over time.
Time series data is widely collected and analyzed in the sports world — for marketing, sports betting, team performance, and more.
Climate change time series data
Climate change is a big topic in the world. The earth's climate is changing over time and has been tremendously accelerating, and time series analysis can help to examine the impact. The risks can be assessed and predicted based on recorded weather data. The recorded data can be analyzed to find trends and correlate with other data from various time intervals.
The following line chart visualizes the CO2 emission rate of the Earth's atmosphere over the past 60 years.
Univariate vs. multivariate time series data
Univariate time series data follows a single target variable over time. For example, the closing price of a stock is a univariate time series data where the price is the variable. In this case, time series data analysis looks at this one independent variable over time to identify trends or patterns.
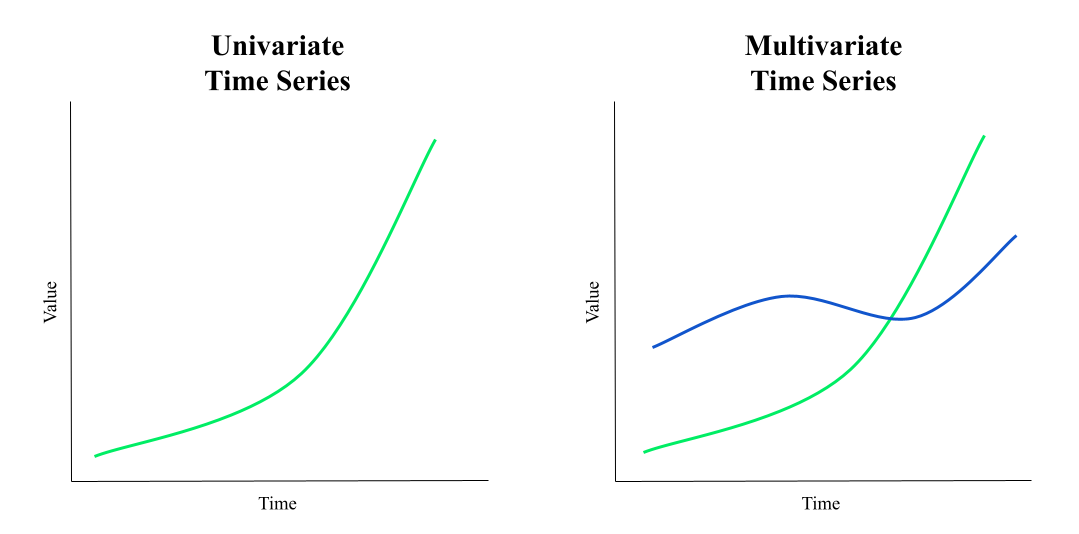
Multivariate time series data is a collection of observed variables (cross-sectional data) that are related to each other. For example, the time series collection of the current weather may be multivariate time series data where the pooled historical data variables are temperature, humidity, wind speed, etc.
The cross-sectional data variables are not only related to their previous values but also to one another. This dependency should be considered when forecasting future trends and values.
Time series data key characteristics
When visualized as a line chart, time series analysis may reveal different characteristics. In the following sections, we'll explore three of the most common characteristics of time series data:
- Trends.
- Seasonality.
- Outliers.
Trends
Trends are the tendency of the data values to increase or decrease over a set period. Trends can be upward or downward.
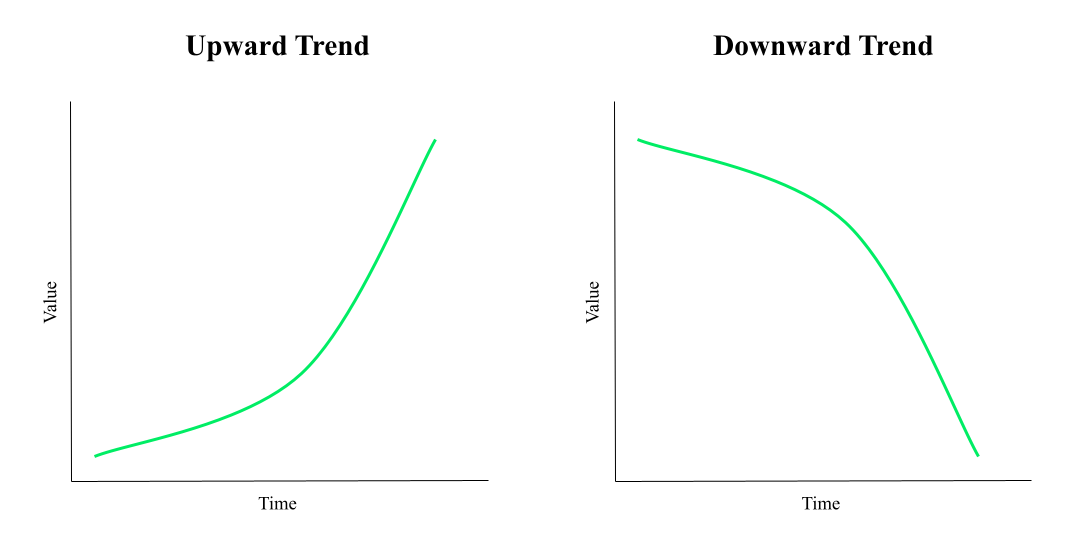
Trends can also be local or global. Local trends are the tendency of the data values to increase or decrease in a specific period. Global trends are the tendency of the data values to increase or decrease over the entire time frame of the data set.
For example, the stock market shows downward trends during times of recession. However, the historical values show that the stock market is going up, proving a global upward trend. Historical trends use past performance to help you better predict future events.
Seasonality
Seasonality is the tendency of the raw data to repeat a pattern over time.
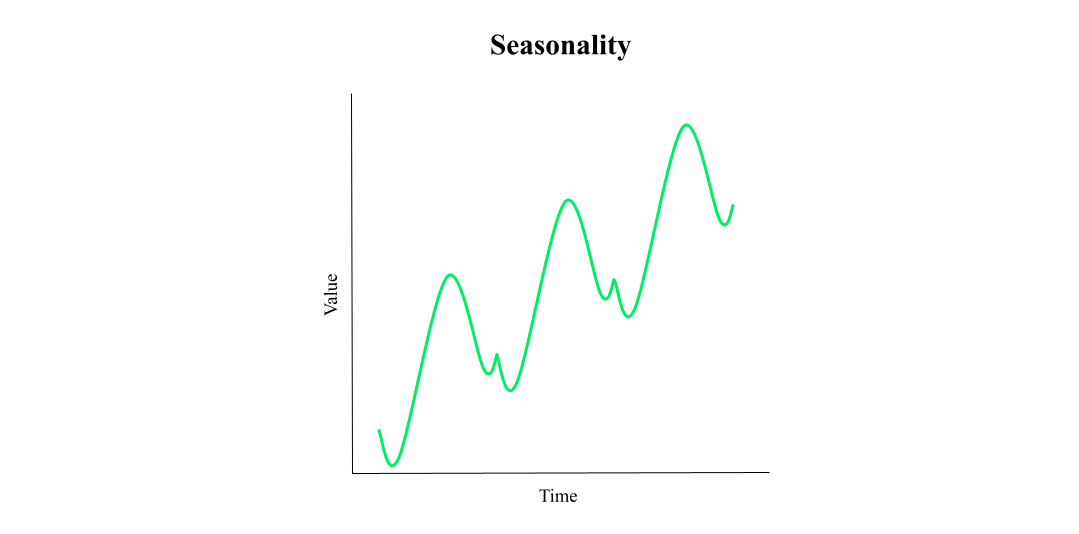
The seasonal cycle is connected to the time intervals of the data. The observed pattern may be repeated every week, every month, every quarter, etc. For example, consumer consumption is a yearly seasonal cycle — every year, personal spendings increase leading up to the winter holidays.
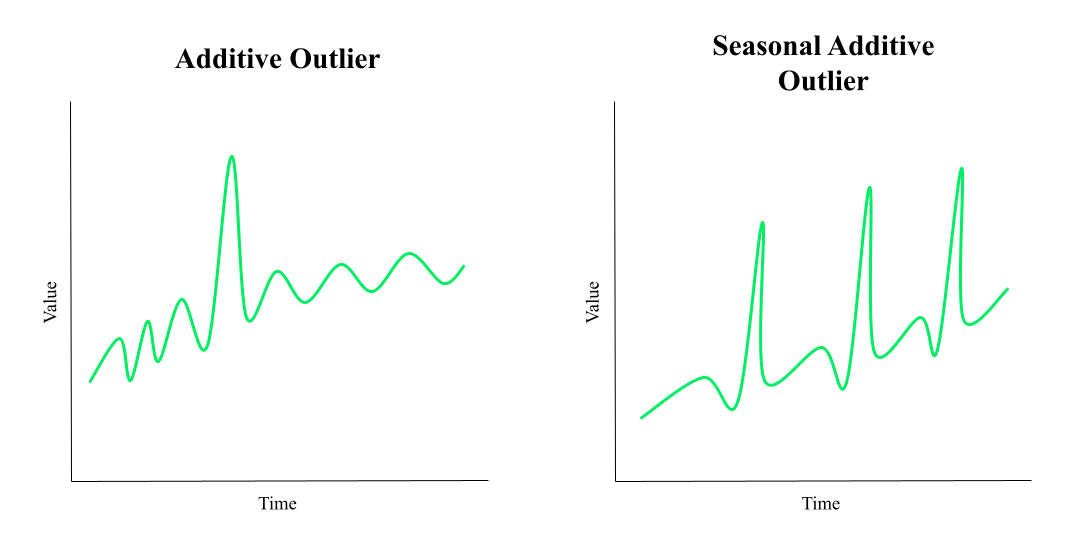
Outliers
Outliers in a time series data set are data fluctuations that cannot be explained by trend or seasonality. These fluctuations are inconsistent with the other data points and associated patterns. They can be caused by errors or events that are not predictable.
When conducting a time series analysis, you might find different types of outliers. For example, an outlier can manifest once — with a few data points in a short and specified period being tremendously different from the surrounding data — or it can be a repeating pattern of fluctuations over a given period.
The former type is known as an additive outlier and the latter is a seasonal additive outlier.
Outliers can influence the statistical time series analysis of data and thus, the statistical significance of time series data. Outlier detection and removal is an important part of statistical time series analysis.
Time series data use cases
We already know that a time series data set can be used for regression analysis and forecasting. But what about other use cases outside of series analysis?
Monitoring
Time series data can be collected and used for real-time monitoring in various industries — for example, in application monitoring where log data is collected to track performance, availability, and use of resources.
Another example of time series data can be seen in the manufacturing industry. Machine stats can be monitored with multiple sensors that generate time series data. For example, the temperature of a machine can be recorded over time. In case of a temperature anomaly, the machine can be shut down to prevent damage. This growing sector of using sensor data is known as industrial IoT (IIoT) monitoring.
Classification
Forecasting is used for predicting future values in time series data. Classification, on the other hand, tries to find patterns in the data to determine the class of the time series at hand. To clarify the difference, let's see a few problems that can be solved with time series classification:
- Smartwatch monitoring that classifies a heart rate as normal or abnormal.
- Detect movement in a video surveillance feed and classify it. For example, differentiate between a person walking and a person running.
- Classify a stock price as rising, falling, or stagnant. Note that this is different from predicting future prices, but the identified class can be used for creating a forecast for series analysis.
How to store and query time series data
While there are several storage options for time series data, the MongoDB data platform is an integrated and optimized solution. The natively supported time series collections provide users with minimal storage costs and efficient queries. MongoDB uses best-in-class columnar compression algorithms to reduce the storage footprint for time series collections, allowing you to store more data for longer at a lower cost.
When modeling data for storage and querying time series data, it's important to answer a few questions:
- What is the structure of the time series data?
- What is the read/write ratio of the data?
- How is data interconnected? What's the cardinality of every relationship?
- How are the data points collected?
- How is the time series data going to be used?
Time series data has the following characteristics:
- The measurements and data points are small storage-wise and sequential — often ordered in time.
- In many cases, large volumes of measurements are recorded in a short amount of time.
- For time series analysis and visualization, it's essential to ensure rapid retrieval of data points based on a period.
Leveraging MongoDB to store and utilize your data
There are several optimized storage solutions for time series data. MongoDB supports time series data with native time series collections, real-time series analysis features, and automatic query optimization.
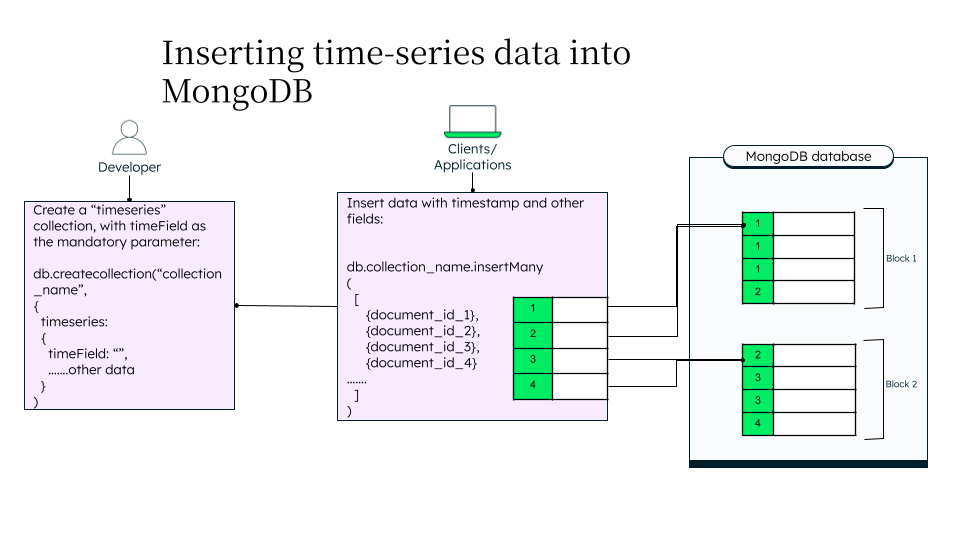
Let’s go through the diagram:
- The first step is to create a collection, similar to a regular MongoDB collection, but marked as a “time-series.” This will help MongoDB identify the data as time series data and store it in the most optimized manner. This is usually done by application developers. Depending on the use case, they can add various relevant fields. The timeField is a mandatory field as MongoDB uses it for sorting the data.
- Once client applications start inserting data into the collection, MongoDB sorts the data based on the unique ID of the data. For example, if you are collecting weather data of a particular city, with city_id as its identifier, MongoDB will use the city_id and the timestamp to sort the data into various “buckets.”
- MongoDB uses a clustered index so that the data is always stored and sorted by timestamp, irrespective of the order in which it is inserted. For example, the data for 09:05:01 might come a bit earlier than the data of 09:04:58 but will still be stored in the correct sorted order.
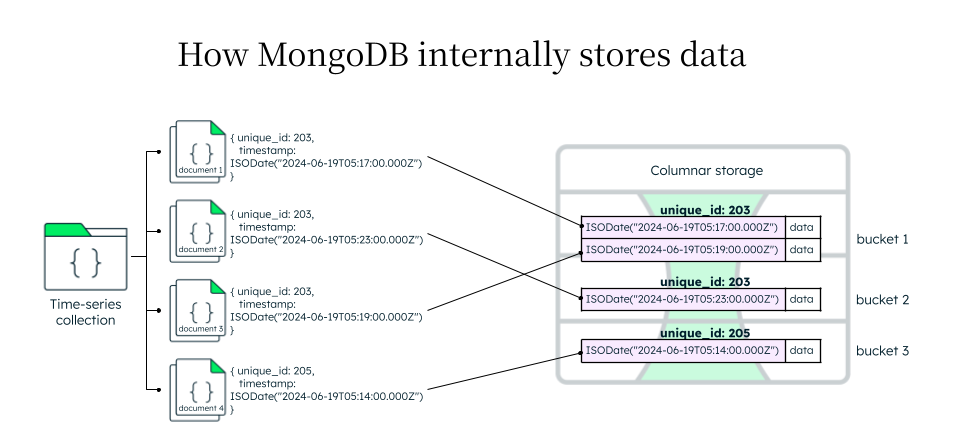
MongoDB uses columnar storage to internally store time series collection data. As the data is received, MongoDB identifies the right bucket to store the data. The unique _id here can be any unique identifier, like a city_id, or sensor_id — something that will really never (or very rarely) change. This id field also acts as a meta field to store additional information about the document, for faster retrieval.
To learn more about how to create a time series collection, view our time series collection page.
The application does not need to know how MongoDB internally stores the data. When an application queries the time-series data, MongoDB does the following:
- Query rewrite and optimization: MongoDB optimizes the query for efficient query execution. This could mean transforming the query structure using pre-computed values (like max_value and min_value) or using indexes to reduce the amount of data to be scanned.
- Bucket identification: Next, MongoDB identifies the right bucket to search for the required data. MongoDB leverages the usage of secondary indexes on fields of the documents to quickly identify the right bucket.
- Bucket unpacking: The bucket stores data in a columnar format. To restore the data and access individual data points, the bucket needs to be unpacked, and the results matching the given query criteria are sent back to the application.
To learn more about MongoDB time-series data features and how they improve your process of analyzing time series data, check out the dedicated Time Series page.
Time series analysis with MongoDB
The MongoDB Query API is a powerful tool for performing time series analysis. You can run analytical queries with window functions or use temporal operators to retrieve the most recent or the oldest data in your collection.
Querying the data points collected with the MongoDB Query API
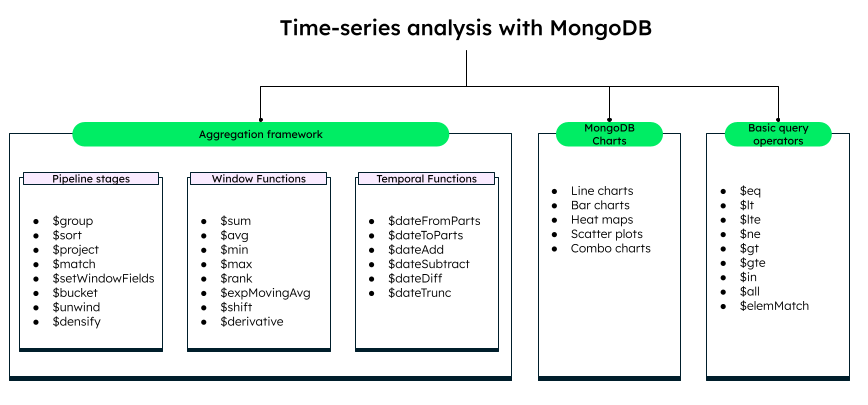
Some important operators and functions that MongoDB provides for time-series analysis are:
- Basic query operators: These provide the criteria to filter and sort documents — for example, less/greater than, less/greater than equals, equal, not equal, and many others. These comparison query operators are used in the $match stage of the aggregation pipeline to filter documents on a specific condition.
- Aggregation pipeline stages: You can use a combination of pipeline stages and various operators on them. For example, you can use the $group stage to find the average, sum, and range, or use the $setWindowFields stage to sort, set specific windows (rows or ranges), or partition data based on a field or expression.
- Window functions: Window functions are used in various stages of the aggregation pipeline. They can be used to find the average, sum, minimum value, maximum value, and many other values useful to aggregate and compare data.
- Temporal functions: Temporal operators and functions are used inside the aggregation stages and can extract specific parts of a date or time, and compare dates and times. These are useful for finding moving averages, trend analyses, daily averages, and other descriptive analyses.
- MongoDB Charts: MongoDB provides powerful charts to represent and visualize data, trends, and patterns. You can apply filters and grouping, aggregate data, configure time intervals, and highlight important trends and events on the chart.
Historical data
Another challenge that arises when working with time series data is archiving historical data. In many cases, analyzing recent data to extract information is crucial. Then, that data can be archived in a lower-cost storage solution. Again, there are several specialized solutions for archiving time series data.
For example, a key feature of MongoDB Atlas Online Archive is that it allows you to set up automated archival of aged data, while also providing the ability to query the archived data. This is usually hard to achieve with cold storage solutions. MongoDB Atlas Online Archive keeps your data queryable while also minimizing the storage cost.
The ability to converge current data with historical data (recent or archived past values) leads to a better, more complete time series analysis of data points.
MongoDB time series also provides an option to set the period after which data should be deleted, known as Time To Live (TTL), from the collection using the expireAfterSeconds parameter. You can specify the value of this parameter while creating the time-series collection.
Conclusion
Time series data has a wide range of applications — from discovering trends and making forecasts to application monitoring and classification. As we saw in this article, time series data can be found everywhere. Collecting these data points and conducting time series analysis to make better-informed decisions is a key part of the business process.
Time series analysis can be a differentiator for your business regardless of the industry. Companies that aren't utilizing it will rapidly fall behind the competition.
The challenge + next steps
By now, you hopefully understand the importance of time series data. Collecting and implementing it is another story entirely.
The nature of time series data requires a specialized storage solution. The integrated MongoDB data platform is a great choice for any business that needs to store and analyze time series data. From archiving old data while keeping it queryable in MongoDB Atlas Online Archive to using state-of-the-art compression algorithms in time series collections, MongoDB has a wide range of features that can help you with your time series analysis needs.
To learn more about elevating your time series analysis, check out the dedicated MongoDB Time Series Data article.