Time series data is information that is tied to a specific time period and stored as a sequence of data points. Every login, transaction, sensor reading, or stock update carries a timestamp, which makes this type of data widely used for real-world applications.
While relational databases and non-relational systems can store timestamps, they are not inherently optimized for time series data management. A time series database is purpose-built for storing, querying, and analyzing this type of data, allowing organizations to efficiently handle large volumes of timestamped data across regular intervals or irregular events.
A brief history of time series databases
The idea of organizing time series data is not new. Businesses, governments, and scientists have always needed a way to capture information tied to a time period. Long before digital databases existed, financial institutions relied on hand-drawn ledgers of historical data such as commodity prices or daily stock values. These early logs were effectively the first examples of time series data management, where events were captured as a continuous sequence of data points.
By the mid-20th century, with the rise of computing, researchers began to formalize time series analysis methods in statistics and economics. Economists like Box and Jenkins developed influential models for analyzing series data, allowing forecasters to detect historical trends, identify seasonal patterns, and even attempt to predict future data points. These statistical models laid the groundwork for how organizations would later structure time stamped data in digital systems.
The 1970s and 1980s brought relational databases, which became the dominant way of storing structured information. Although relational databases could store dates and timestamps, they weren’t designed for the unique demands of time series data. Financial services firms, for instance, struggled to manage financial time series data like trades and tick data at scale. Operations teams dealing with application performance monitoring or network metrics also pushed against the limits of relational storage, as they needed to capture high-frequency data points collected over short time intervals.
By the late 1990s and early 2000s, the emergence of the internet, digital sensors, and large-scale monitoring systems created a new problem: the sheer volume and velocity of time series data. Enterprises began experimenting with specialized approaches—either custom-built databases or extensions of existing platforms—to better manage temporal data. The goal was not only to store the information but also to enable faster queries, real-time analytics, and data mining for insights.
The 2010s marked the true rise of the dedicated time series database. Projects like InfluxDB, Prometheus, and Tiger Data were built specifically to handle irregular time intervals, high-ingest rates, and large-scale data workloads. These databases were optimized for operations such as downsampling, trend analysis, and anomaly detection. They also included built-in functions for signal processing and advanced time series analysis, making them attractive for modern use cases like IoT telemetry, supply chain management, and patient health monitoring.
Today, the evolution has come full circle. While specialized time series databases still play an important role, platforms like MongoDB offer the ability to manage both series data and other data types in one unified system. This hybrid approach means organizations no longer need to choose between a narrow time series database and a general-purpose one. Instead, they can run time series analysis, query historical data, apply machine learning, and integrate with data visualization tools—all within the same data infrastructure.
The history of time series databases reflects the broader history of data itself: from simple ledgers to relational systems to modern platforms capable of handling future data points at scale. As organizations continue to collect more IoT data, weather data, and financial data across multiple time periods, the ability to store, query, and analyze time series data efficiently will remain central to innovation and better business performance.
Benefits of time series databases
Modern organizations generate a constant stream of time series data, from IoT data and financial time series data to operational metrics and customer interactions.
Managing this at scale requires more than simple storage—it demands a system that can deliver speed, intelligence, and efficiency. A dedicated or hybrid time series database provides exactly that.
The benefits go beyond technical performance to deliver substantial business value in the form of improved forecasting, better decision making, and deeper insights.
Efficient storage and compression
Time series databases are optimized for append-only operations, meaning new series data is continuously added without costly rewrites.
This model significantly reduces overhead compared to traditional relational databases. Older historical data can be compressed using specialized algorithms, which allows organizations to maintain long histories of observed data without exploding storage costs.
By balancing hot storage for active queries with archival for older records, businesses can keep an extensive data set available for both day-to-day monitoring and long-term time series analysis.
Faster querying
Indexing based on time is a core feature of time series data management. Instead of scanning across unrelated fields, queries can directly target a specified period or set of time intervals, returning results far more quickly.
This is especially important when working with large-scale data from IoT sensors, web traffic, or weather data, where billions of data points collected must be sliced into meaningful windows. Efficient querying not only accelerates time series data analysis but also enables real-time dashboards, interactive exploration, and exploratory analysis.
Near real-time analytics
The ability to process time-stamped data as it arrives is one of the most powerful capabilities of a time series database.
Continuous ingestion combined with optimized writes allows for near real-time analytics across diverse use cases: monitoring industrial equipment, running application performance monitoring, detecting anomalies in patient health monitoring, or supporting algorithmic trading in finance.
Because the data is indexed on arrival, businesses can both detect issues as they happen and build models to predict future data points.
Advanced computing and predictive analysis
Beyond basic queries, modern time series databases integrate advanced computing features. This includes built-in support for time series analysis methods, statistical functions, and even machine learning workflows.
For example, organizations can apply signal processing techniques to sensor streams, use pattern recognition to identify seasonal patterns, or run trend analysis on financial data.
These tools make it possible to forecast future values, detect outliers, and simulate future events with confidence. When combined with visualization platforms, this creates a powerful loop of collecting, analyzing, and acting on data in near real time.
Lifecycle management and cost control
Managing an extensive data set requires thoughtful lifecycle strategies. Time series databases simplify this with automated retention policies that define how long raw data is stored, when it should be aggregated, and when it should be archived.
For example, millisecond-level data might be kept for a week, while hourly summaries are retained for a year.
This balance ensures organizations can continue to generate reports, spot historical patterns, and run audits without overwhelming storage systems. Lifecycle automation also reduces operational complexity, giving teams more time to focus on insights rather than infrastructure.
Driving better business outcomes
Ultimately, the benefits of a time series database extend beyond IT.
By enabling faster access to historical data, identifying anomaly detection early, and supporting future data forecasting, businesses can identify trends and take proactive steps.
Whether it’s optimizing supply chain management, improving business performance, or driving innovation through machine learning and data mining, a strong foundation for series data directly impacts strategic agility and resilience.
Use cases for time series data
Although time series databases were first popularized in finance, their role has expanded far beyond tracking trades and prices. Today, organizations across every sector rely on time series data for forecasting, monitoring, and optimization. Because so much information is generated as a continuous sequence of data points tied to a time period, the applications are nearly limitless. Some of the most important use cases include:
- IoT and sensor data.
- Sales forecasting and supply chain management.
- Financial time series data.
- Application performance monitoring.
- Patient health monitoring.
IoT and sensor data
With billions of connected devices generating streams of series data, managing IoT data has become one of the most important functions of a time series database.
Smart home devices track usage patterns, wearable health monitors record vitals at regular intervals, and industrial systems continuously monitor temperature, vibration, and pressure. Low-latency ingestion and real time analytics are critical here, since anomaly detection can prevent equipment failure, improve safety, or even alert users to health issues.
Over time, historical data from IoT sensors can also be used in time series analysis methods to identify historical trends and anticipate future events.
Sales forecasting and supply chain management
Retailers, manufacturers, and logistics providers rely heavily on time series data to optimize operations. By analyzing past sales and inventory fluctuations, organizations can identify seasonal patterns and use statistical models to predict future data points.
For example, demand for winter clothing or holiday products follows a predictable curve that can be captured through time series analysis. When extended to supply chain management, these forecasts help ensure inventory arrives at the right location and time, reducing waste while improving customer satisfaction.
Financial time series data
The financial sector was one of the earliest adopters of time series databases, and for good reason. Every market tick, trade, or transaction is a time-stamped data event. Banks and investment firms use time series analysis to run stock market analysis, build risk models, and detect unusual activity.
Beyond trading, financial time series data powers credit scoring, fraud detection, and decision making in loan approvals.
Because queries often span billions of data points collected over short time intervals, a time series database provides the speed and scale that traditional systems cannot.
Application performance monitoring
In the software world, application performance monitoring (APM) is critical for ensuring uptime and customer experience. Logs, latency metrics, and error rates are all captured as series data across consistent intervals. A time series database can aggregate this information in real time, enabling engineers to detect bottlenecks or outages as they happen.
Over longer periods of time, historical patterns can reveal recurring issues or point to needed infrastructure improvements. This combination of real-time analytics and long-term trend analysis makes APM one of the most common and impactful use cases.
Patient health monitoring
Healthcare increasingly depends on time-based data for tracking patient well-being.
From heart rate monitors to ICU sensors, vital signs are collected at regular intervals and stored as series data. Clinicians use anomaly detection to flag sudden changes, while time series analysis supports longer-term insights into disease progression, treatment effectiveness, or recovery.
For instance, continuous glucose monitors rely on time series databases to store and analyze readings, generating insights that can help patients and providers make timely interventions.
With advances in machine learning and signal processing, the potential for predictive healthcare applications is only growing.
Additional emerging use cases
- Weather data and climate modeling: Tracking time series data stored over decades allows researchers to analyze historical trends and forecast future values like rainfall, temperature, or extreme events.
- Energy and utilities: Smart meters and grids depend on time series analysis for balancing supply and demand, detecting outages, and improving efficiency.
- Telecommunications: Network operators analyze temporal data from call records, bandwidth usage, and dropped connections to optimize performance.
- Cybersecurity: Logs and alerts captured as series data help identify anomalies and detect threats before they escalate.
Examples of time series data
If you think about it, all the data that we store has a timestamp attached to it. For example, log files, customer login times, sensor data from IoT devices, traffic data, weather data, and browser history all have timestamps attached.
Time series data can be measured in seconds and minutes (like sensor-based devices), hourly (like phone usage), daily (petrol price), weekly (timesheets), monthly (electricity consumption), quarterly (performance reports), half-yearly (company growth), or annually (profits and revenue). Time series data can be at regular intervals or event-driven (irregular):
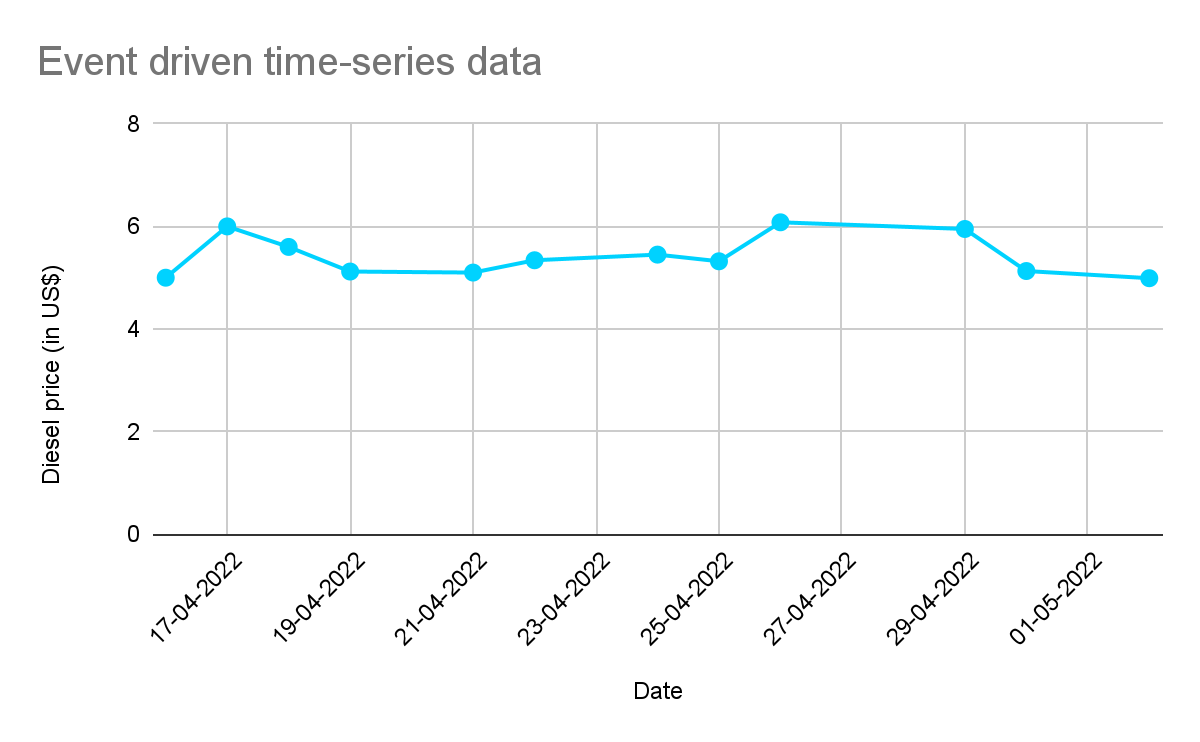
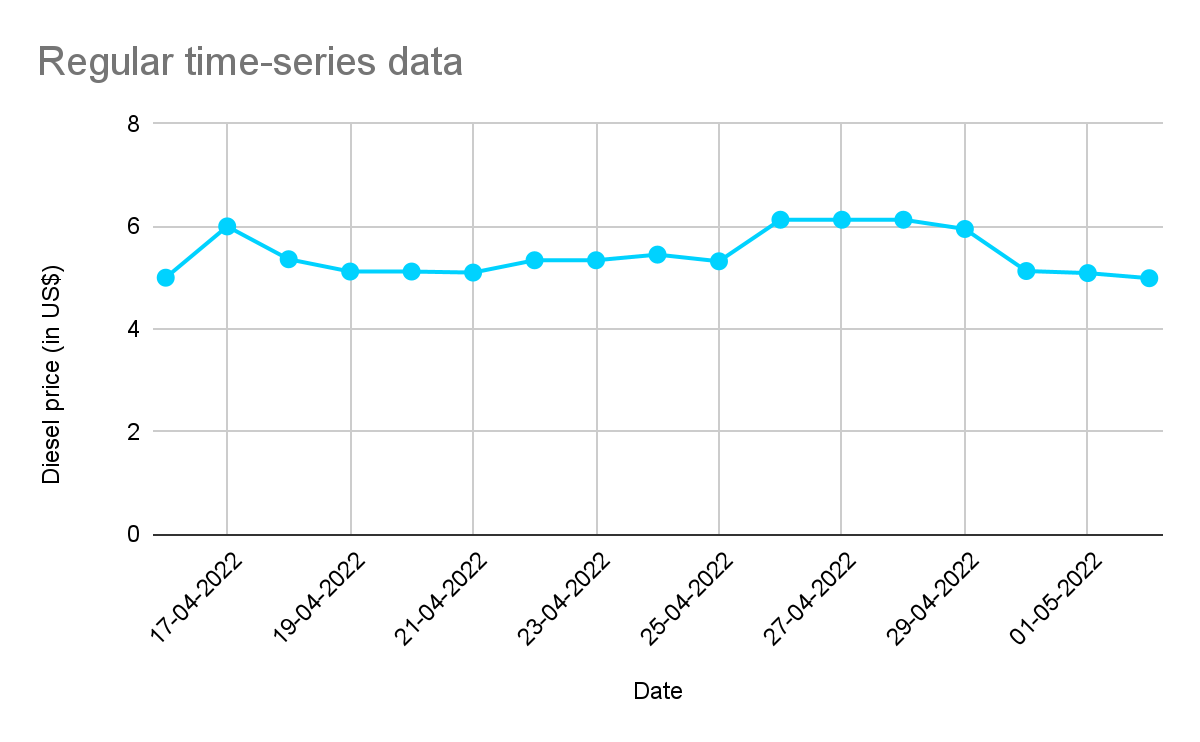
In event-driven time series data, a new row is inserted only if there is a change in the price of diesel (event). In regular time series data, the price is checked at regular intervals. When plotted, time series data will always have one time axis.
The above examples are of linear time series data, where each point can be viewed as the linear combination between past, present, and future data, and can be analyzed using regression, auto-correlation, and other methods.
Time series database
Databases that provide special features to efficiently handle (store, manipulate, and retrieve) time series data are called time series databases. Some popular time series databases are Prometheus, InfluxDB, and Tiger Data. General-purpose databases like MongoDB provide time series collections to handle time series data, so you can get the benefits of both a time series and a non-relational database in one.
How is data stored in a time series database?
As shown in the above example, data in a time series database has a timestamp and at least one metric related to it. For example, the diesel price was $5.45 (metric) on 24-04-2022. We can add more metrics as well—for example, petrol price, stock prices, or the number of cars visiting the state museum.
This way, we can store any amount of data that changes with time. Time series data is almost always appended in comparison to updates or deletion. That means databases can have huge workloads, and even indexes may not be enough for optimization. Also, more often than not, you would want statistics or aggregates collected over a time period—for example, average diesel prices from 24-04-2022 to 01-05-2022. Time series databases are optimized for performance as well as performing specialized functions.
How does a time series database work?
Time series databases store data as time-value pairs for easy analysis and querying. Time series databases can efficiently handle concurrent series—i.e., multiple metrics parallel—making them well-suited for banking and financial transactions.
There are three aspects of a time series database: database features, time series features, and data features.
Database features
This includes the basic create, read, update, and delete (CRUD) features, as well as features like high availability, scalability, and reliability. The database should be able to handle large amounts of writes, and reads/updates should be at particular time windows.
Time-series features
The time is stored as a timestamp, which includes the time in precision of seconds and milliseconds. Date can be stored in various formats using the DateTime data type. Timestamp supports calendar and time zone adaptation. Time series databases also provide support for getting aggregations and statistics about the data based on time.
Data features
Data is appended in the sequence of time and is stored as time, value, and events. Data can have many dimensions. The data often does not require relationships between entries of different tables and older data is purged or compressed and archived.
Fulfilling time series database requirements with MongoDB
A time series database should satisfy the following requirements:
- High capacity to handle huge volumes of data
- In-memory interactive dashboards for live updates, trends, events, and alerts
- Quick querying capabilities and access to Machine Learning and Artificial Intelligence algorithms for analytics
- Support for standard queries and custom statistical functions for working with time series data
- Ability to handle multiple logins, multiple queries, and high load
MongoDB’s data platform provides all of these features and is quite suitable for handling time series data. You can access MongoDB data from anywhere using MongoDB Atlas, MongoDB’s cloud-based application data platform.
Why MongoDB for time series data?
MongoDB provides time series collections that combine the scalability of a general-purpose database with the specialized capabilities of a dedicated time series database. This means you can run time series analysis side by side with unstructured, relational, or cross sectional data—all within one platform.
With MongoDB Atlas, you get:
- Global cloud availability for your time-based data.
- Built-in support for machine learning (for vector search) and data visualization integrations.
- High throughput writes and real-time reads.
- Flexible schema for evolving series data structures.
MongoDB delivers better performance at scale, helping teams transform observed data into insights, identify trends, and prepare for future events.
Read more about MongoDB’s limitations of time series collections to ensure this method will work best for your needs.
Ready to get started?
MongoDB provides advanced query capabilities as well as time series collections, which makes it suitable for handling time series data. Being a non-relational database, MongoDB offers better scalability and performance. With MongoDB Atlas, you can access and query data from anywhere in the world.