MongoDB Atlas 具有一套强大的内置指标、遥测和日志,您可以从 Atlas 中利用这些功能,或将其集成到第三方可观测性和警报堆栈中。这使您能够监控和管理 Atlas 部署,并主动地实时响应事件。
通过监控部署,您可以:
了解集群的运行状况和状态
了解在集群上运行的操作如何影响数据库
了解您的硬件是否资源有限
执行工作负载和查询优化
检测并实时响应问题,以改进应用程序堆栈
Atlas 提供了多种用于监控和警报的指标。您可以通过可视化仪表盘和 API 追踪部署的运行状况、可用性、消耗和性能。您还可以查看各种集群指标,监控数据库性能,配置警报和警报通知,并下载活动日志。
Atlas 监控和警报的功能
衡量标准 | 部署指标可让您见解硬件性能和数据库运行效率。Atlas收集服务器、数据库和MongoDB进程的指标,并以 各种粒度级别存储指标数据。对于每个粒度级别, Atlas都会将指标计算为下一个更细粒度级别所报告指标的平均值。许多指标都有对应的突发报告。 您可以在 Atlas UI 中使用“指标”视图、“实时性能面板”、“查询分析器”、“Performance Advisor”和“命名空间见解”页面来监控指标。您还可以使用 Atlas CLI 或 Atlas Administration API 将指标导入到所选择的工具中。 以下 Atlas UI“指标”视图显示了可用于监控示例三节点副本集的各种指标: 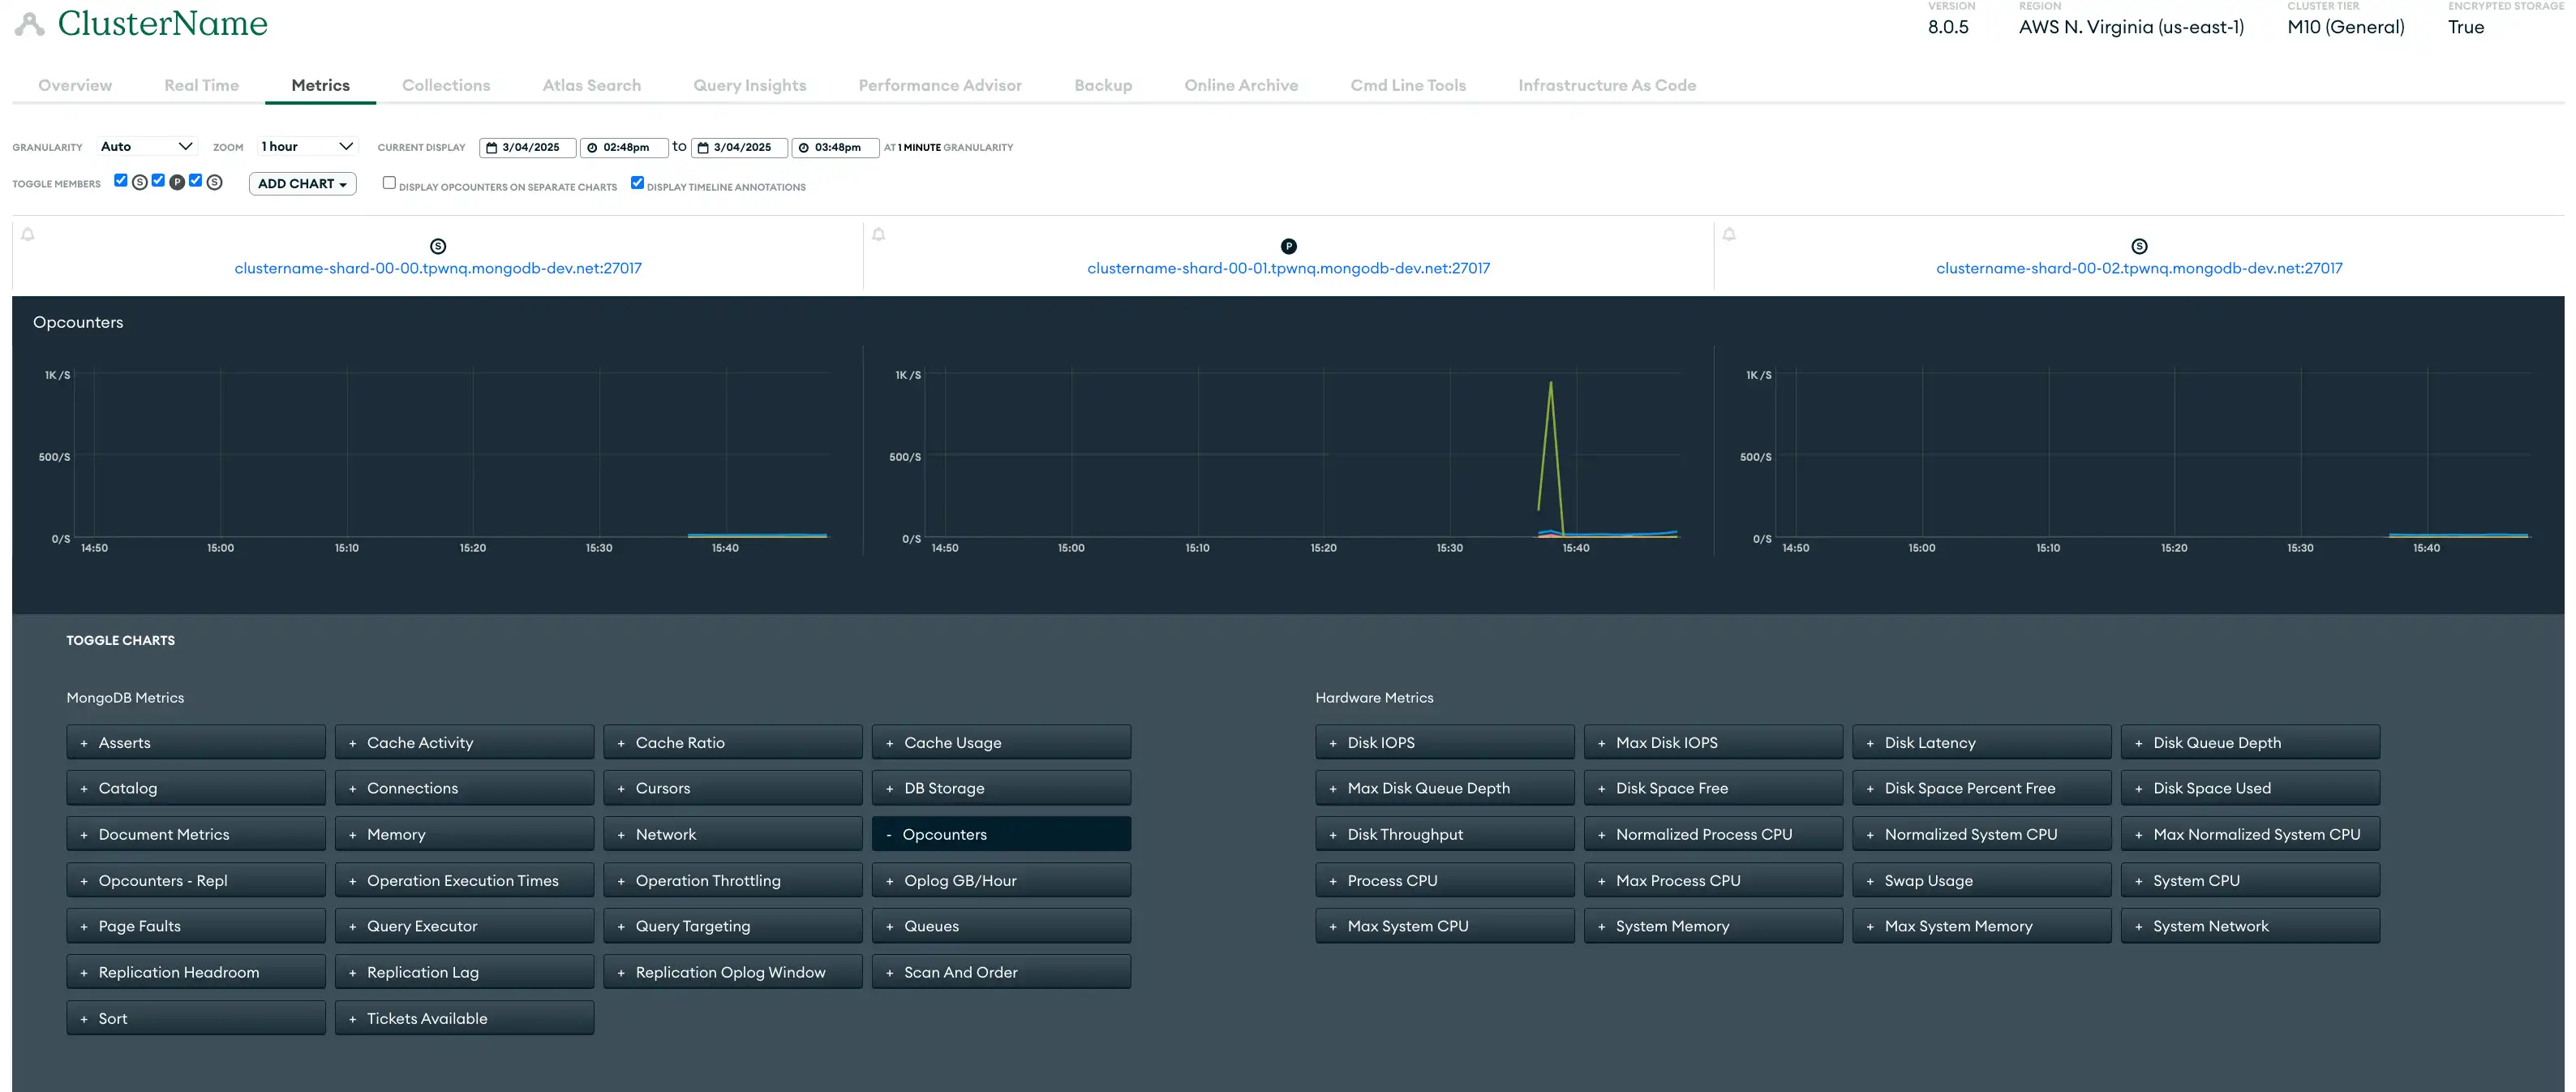 点击放大 |
警报 | Atlas 提供超过 200 种事件类型的警报,允许您定制警报以实现精确监控。Atlas 会根据警报设置中配置的数据库和服务器条件发出警报。当某个条件触发警报时,Atlas 会在集群上显示警告符号并发送警报通知。 您可以使用Atlas 用户界面、 Atlas Administration API、 Atlas CLI和集成的 Terraform资源来配置警报和警报通知。 |
监控 | Atlas监控可视化可深入了解各种关键指标,包括硬件性能和数据库运行效率。用于网络和操作可见性的实时性能面板、用于跟踪效率趋势的查询分析器以及自动索引建议等工具使您可以更有效地监控和排除问题,从而提高操作效率。示例,这些图表可以帮助您了解服务器重新启动和选举对数据库性能的影响。 |
日志 | Atlas为集群中的每个进程提供日志。每个进程都在自己的日志文件中记录其活动。 您可以通过 Atlas UI、Atlas CLI 和 Atlas Administration API 来下载日志。如需了解更多信息,请参阅 Atlas 审核和日志记录指导。 |

关于 Atlas 监控和警报的建议
单区域部署在与 Datadog 和 Prometheus 等第三方警报工具集成时没有特别的考虑因素。请参阅所有部署范式建议。
在多区域集群中,您需要考虑与跨区域传输日志和指标相关的潜在数据传输成本。我们建议您配置日志记录和审核系统,以最大程度减少跨区域的数据传输,尽可能将日志保留在生成它们的本地区域内。
所有部署范式建议
以下建议适用于所有部署范式。
使用指标进行监控
要监控您的集群或数据库性能,您可以查看集群指标,例如历史吞吐量、性能和利用率指标。下表列出了一些(但不是全部)需要监控的重要指标类别:
Atlas 集群操作与连接指标 |
|
硬件指标 |
|
复制指标 |
|
您可以使用Atlas用户界面、 Atlas管理API和Atlas CLI来查看Atlas 集群指标。此外, Atlas提供与Datadog和Prometheus等第三方工具的内置,您还可以利用Atlas Administration API与其他自定义指标工具集成。
要学习;了解更多信息,请参阅查看集群指标。
通过配置警报进行监控
Atlas 扩展到您现有的可观测性堆栈,以便您可以获得警报并做出数据驱动的决策,而无需替换当前工具或更改工作流程。Atlas 可以通过 Microsoft Teams、PagerDuty、DataDog、Opsgenie、Splunk On-Call 等第三方工具发送警报通知,以便您在同一位置查看数据库和全栈性能。
为安全事件配置警报和通知,例如登录尝试失败、异常访问模式和数据泄露。在开发和测试环境中,我们建议为已闲置七天或更长时间的集群配置警报,以帮助您识别可以关闭以节省成本的集群。
当您在Atlas用户界面中查看警报时,我们建议您使用可用的筛选器按托管、副本集、集群、分片等限制结果,以帮助关注最关键的警报。
推荐的 Atlas 警报配置
我们建议至少配置以下警报。这些警报建议提供了基线,但您应根据工作负载特征进行调整。如果下表中指定了“高优先级”条件,我们建议您为同一条件配置多个警报,一个针对低优先级的严重性级别,一个针对高优先级的严重性级别。这允许您为每个单独配置警报通知设置。
Atlas 默认配置一些警报。如需了解有关默认警报设置的信息,请参阅默认警报设置。
条件 | 推荐的警报阈值:低优先级 | 推荐的警报阈值:高优先级 | 关键见解 |
|---|---|---|---|
Oplog Window | < 24小时,持续 5 分钟 | < 1小时,持续 10 分钟 | 监控复制 oplog 窗口和复制空间,以确定辅助节点是否很快需要完全重新同步。复制 oplog 窗口通常有助于提前确定辅助节点对计划内和计划外中断的恢复能力。 |
选举事件 | > 3 持续 5 分钟 | > 30 持续 5 分钟 | 监控选举事件,当主节点降级并且从节点被选为新的主节点时,就会发生选举事件。频繁的选举事件可能会扰乱操作并影响可用性,导致暂时无法写入和可能的数据回滚。将选举事件保持在最低限度,可确保写入操作的一致性和集群性能的稳定性。 |
阅读 IOPS | > 4000 持续 2 分钟 | > 9000 持续 5 分钟 | 监控磁盘 IOPS 是否接近预配的最大 IOPS。确定集群是否可以处理将来的工作负载。 |
写入 IOPS | > 4000 持续 2 分钟 | > 9000 持续 5 分钟 | 监控磁盘 IOPS 是否接近预配的最大 IOPS。确定集群是否可以处理将来的工作负载。 |
读取延迟 | > 20 毫秒,持续 5 分钟 | > 50 秒持续 5 分钟 | 监控磁盘延迟以跟踪读取和写入磁盘的效率。 |
写入延迟 | > 20 毫秒,持续 5 分钟 | > 50 毫秒,超过 5 分钟 | 监控磁盘延迟以跟踪读取和写入磁盘的效率。 |
交换使用 | > 2 GB ,持续 15 分钟 | > 2 GB ,持续 15 分钟 | 监视内存以确定是否升级到更高的集群层。此指标表示指标粒度指定的时间段内的平均值。 |
主机关闭 | 15 分钟 | 24 小时 | 监控主机以及时检测停机情况。托管停机时间超过 15 分钟可能会影响可用性,而停机时间超过 24 小时则非常严重,会危及数据可访问性和应用程序性能。 |
无主节点 (primary node in the replica set) | 5 分钟 | 5 分钟 | 监控副本集的状态,以确定没有主节点 (primary node in the replica set)节点的实例。缺少主节点 (primary node in the replica set)超过 5 分钟可能会停止写入操作并影响应用程序功能。 |
缺少活动 | 15 分钟 | 15 分钟 | 监控活动 |
页面错误 | > 50/秒,持续 5 分钟 | > 100/秒,持续 5 分钟 | 监控页面错误以确定是否增加内存。该指标显示所选示例周期内该进程每秒的平均页面错误率。在非 Windows 环境中,这仅适用于硬页面错误。 |
复制延迟 | > 240 秒持续 5 分钟 | > 1 小时,持续 5 分钟 | 监视复制延迟以确定从节点是否可能脱离 oplog。 |
备份失败 | 任何情况下 | 无 | 跟踪备份操作以确保数据完整性。备份失败可能会影响数据可用性。 |
已恢复备份 | 任何情况下 | 无 | 验证恢复的备份,确保数据完整性和系统功能。 |
回退快照失败 | 任何情况下 | 无 | 监控备用快照操作,确保数据冗余和恢复能力。 |
备份计划滞后 | > 12 小时 | > 12 小时 | 检查备份计划,确保其追踪进行。落后可能会导致数据丢失并影响恢复计划。 |
排队读取 | > 0-10 | > 10+ | 监控排队读取,确保高效的数据检索。高水平的排队读取可能表明存在资源限制或性能瓶颈,需要进行优化以保持系统响应能力。 |
排队写入 | > 0-10 | > 10+ | 监控排队写入,维持高效的数据处理。高水平的排队写入可能表明资源限制或性能瓶颈,需要进行优化以维持系统的响应能力。 |
过去一小时重新启动的次数 | > 2 | > 2 | 跟踪过去一小时内的重启次数,以检测不稳定或配置问题。频繁重启可能表明根本的问题,需要立即调查,以保持系统可靠性和正常运行时间。 |
任何情况下 | 无 | 监控主节点 (primary node in the replica set)选举,确保集群稳定运行。频繁的选举可能表明网络问题或资源限制,可能会影响数据库的可用性和性能。 | |
不再需要维护 | 任何情况下 | 无 | 查看不必要的维护任务,以优化资源并尽量减少中断。 |
维护已开始 | 任何情况下 | 无 | 追踪维护任务的启动情况,确保计划活动顺利进行。适当的监督有助于保持系统性能,最大限度地减少维护期间的宕机时间。 |
已安排维护 | 任何情况下 | 无 | 监控计划的维护,以准备应对潜在的系统影响。 |
> 5%(持续 5 分钟) | > 20%(持续 5 分钟) | 监控 AWS EC2 集群的 CPU 窃取情况,当发现性能不稳定时,及时识别因共享核心导致的 CPU 使用率超出保证基准的情况。高窃取百分比表示 CPU 信用余额已耗尽,影响性能。 | |
CPU | > 75%(持续 5 分钟) | > 75%(持续 5 分钟) | 监控 CPU 使用情况,以确定是否从磁盘而不是内存中检索数据。 |
磁盘分区使用情况 | 90% 以上 | > 95%(持续 5 分钟) | 监控磁盘分区使用情况,确保有足够的存储可用性。高使用量可能会导致性能下降和潜在的系统中断。 |
要学习;了解更多信息,请参阅配置和解决警报。
使用 Atlas 内置工具进行监控
Atlas 提供了多种工具,使您能够主动监控和提升数据库的性能。
实时性能面板
Atlas用户界面中的实时性能面板(RTPP) 可在Atlas用户界面中以一秒的粒度深入了解有关主机的当前网络流量、数据库操作和硬件统计信息。我们建议您使用 RTPP 来:
直观地识别相关数据库操作
评估查询执行时间
评估已扫描文档与已返回文档的比率
监控网络负载和吞吐量
发现副本集从节点上的潜在复制延迟
在操作完成之前终止操作,以释放宝贵的资源
RTPP 无法从Atlas Administration API监控,但您可以使用“更新一个项目设置”从Atlas Administration API启用和禁用 RTPP。
要了解更多信息,请参阅监控实时性能。
Query Profiler
查询分析器识别出速度缓慢的查询和瓶颈,并建议优化索引和重构查询以提升数据库性能。它在 Atlas 用户界面中提供了对 24 小时窗口内最慢操作的可视化,使识别查询效率的趋势和异常值变得更加容易。我们建议您使用这些数据来定位并解决性能不佳的查询,以减少性能开销。
您可以返回日志查询分析器通过返回慢速查询从Atlas Administration API中识别的慢速查询的日志行。
如需了解更多信息,请参阅使用 Query Profiler 监控查询性能。
性能顾问
Performance Advisor 会自动分析运行缓慢的查询的日志,并建议创建和删除索引。该功能会分析慢速查询,按影响分值排序后,为每个集合提供基于实际工作负载的个性化索引建议。这为您提供了一种简单、即时的方法来实现高效的性能改进。建议定期监控慢速查询,并选择性启用分析器以最大限度减少开销。
您可以使用Atlas用户界面、 Atlas CLI和Atlas Administration API从Performance Advisor中查看慢速查询以及提高查询性能的建议。
您可以返回Performance Advisor日志返回慢速查询 从Atlas Administration API中识别的慢速查询的日志行。要使用Atlas Administration API返回建议的索引等,请参阅Performance Advisor。
如需了解更多信息,请参阅使用 Performance Advisor 监控和改进慢查询。
命名空间见解
Atlas 用户界面中的 Namespace Insights 页面允许您监控集合级别的性能和使用指标。它针对您指定用于监控的集合,显示特定主机和操作类型的指标(如集合上的 CRUD 操作数)和统计信息(如平均查询执行时间)。这样,您可以更详细地了解集合级性能,利用这些信息来优化数据库性能、解决问题,并做出关于扩展、索引和查询优化的决策。
如需了解更多信息,请参阅使用 Namespace Insights 监控集合级别的查询延迟。
活动提要
Atlas 用户界面中的组织操作日志和项目操作日志分别列出了给定 Atlas 组织或项目发生的所有事件。您可以为每个操作日志按事件类型和时间范围进行过滤,以监控 API 访问更新、警报配置更改等事件。这使您能够以所需的详细程度查看您组织或项目的活动记录。
您可以使用 Atlas 用户界面、Atlas CLI 和 Atlas 管理 API 从每个操作日志中检索事件。要了解更多信息,请参阅查看操作日志。
使用日志进行监控
Atlas 保留最近 30 天的日志消息和系统事件审核消息。您可以在其保留期结束前的任何时间点,通过 Atlas 用户界面、Atlas Administration API 和 Atlas CLI 下载 Atlas 日志。
要了解更多信息,请参阅查看和下载 MongoDB 日志。
您还可以将日志导出到 AWS S3 存储桶。配置此功能后,Atlas 每分钟从 mongod、mongos 和 Atlas 审核日志导出到 AWS S3 存储桶。
自动化示例:Atlas 监控和日志记录
以下示例演示如何使用 Atlas 自动化工具启用监控。
查看集群指标
运行以下命令,检索指定磁盘的已用空间和可用空间的数量。此指标可用于确定系统是否正在耗尽可用空间。
atlas metrics disks describe atlas-lnmtkm-shard-00-00.ajlj3.mongodb.net:27017 data \ --granularity P1D \ --period P1D \ --type DISK_PARTITION_SPACE_FREE,DISK_PARTITION_SPACE_USED \ --projectId 6698000acf48197e089e4085 \
配置警报
当您的部署没有主节点 (primary node in the replica set)时,运行以下命令以创建发送到电子邮件解决的警报通知。
atlas alerts settings create \ --enabled \ --event "NO_PRIMARY" \ --matcherFieldName CLUSTER_NAME \ --matcherOperator EQUALS \ --matcherValue ftsTest \ --notificationType EMAIL \ --notificationEmailEnabled \ --notificationEmailAddress "myName@example.com" \ --notificationIntervalMin 5 \ --projectId 6698000acf48197e089e4085
监控数据库性能
运行以下命令,为您的项目启用 Atlas 管理的慢速操作阈值。
atlas performanceAdvisor slowOperationThreshold enable --projectId 56fd11f25f23b33ef4c2a331
下载日志
运行以下命令下载压缩文件,其中包含项目中指定托管的MongoDB日志。
atlas logs download cluster0-shard-00-00.a1b2c.mongodb.net mongodb.gz
请参阅Atlas架构Go SDK Github存储库中单个项目中的所有Atlas架构中心Go SDK 示例。
在您能够使用 Atlas Go SDK 进行身份验证并运行示例脚本之前,您必须:
创建 Atlas 服务帐户。请在终端中运行以下命令,将您的客户端 ID 和密钥存储为环境变量:
export MONGODB_ATLAS_SERVICE_ACCOUNT_ID="<insert your client ID here>" export MONGODB_ATLAS_SERVICE_ACCOUNT_SECRET="<insert your client secret here>" 在您的 Go 项目中设置以下配置变量:
configs/config.json{ "MONGODB_ATLAS_BASE_URL": "https://cloud.mongodb.com", "ATLAS_ORG_ID": "32b6e34b3d91647abb20e7b8", "ATLAS_PROJECT_ID": "67212db237c5766221eb6ad9", "ATLAS_CLUSTER_NAME": "myCluster", "ATLAS_PROCESS_ID": "myCluster-shard-00-00.ajlj3.mongodb.net:27017" }
查看集群指标
以下示例脚本演示了如何检索指定磁盘上的已用空间和可用空间的数量。此指标可用于确定系统是否正在耗尽可用空间。
// See entire project at https://github.com/mongodb/atlas-architecture-go-sdk package main import ( "context" "encoding/json" "fmt" "log" "atlas-sdk-examples/internal/auth" "atlas-sdk-examples/internal/config" "atlas-sdk-examples/internal/metrics" "github.com/joho/godotenv" "go.mongodb.org/atlas-sdk/v20250219001/admin" ) func main() { envFile := ".env.development" if err := godotenv.Load(envFile); err != nil { log.Printf("Warning: could not load %s file: %v", envFile, err) } secrets, cfg, err := config.LoadAllFromEnv() if err != nil { log.Fatalf("Failed to load configuration %v", err) } ctx := context.Background() client, err := auth.NewClient(ctx, cfg, secrets) if err != nil { log.Fatalf("Failed to initialize authentication client: %v", err) } // Fetch disk metrics with the provided parameters p := &admin.GetDiskMeasurementsApiParams{ GroupId: cfg.ProjectID, ProcessId: cfg.ProcessID, PartitionName: "data", M: &[]string{"DISK_PARTITION_SPACE_FREE", "DISK_PARTITION_SPACE_USED"}, Granularity: admin.PtrString("P1D"), Period: admin.PtrString("P1D"), } view, err := metrics.FetchDiskMetrics(ctx, client.MonitoringAndLogsApi, p) if err != nil { log.Fatalf("Failed to fetch disk metrics: %v", err) } // Output metrics out, err := json.MarshalIndent(view, "", " ") if err != nil { log.Fatalf("Failed to format metrics data: %v", err) } fmt.Println(string(out)) }
下载日志
以下示例脚本演示了如何下载和解压缩包含您 Atlas 项目中指定托管的 MongoDB 日志的压缩文件:
// See entire project at https://github.com/mongodb/atlas-architecture-go-sdk package main import ( "context" "fmt" "log" "atlas-sdk-examples/internal/auth" "atlas-sdk-examples/internal/config" "atlas-sdk-examples/internal/fileutils" "atlas-sdk-examples/internal/logs" "github.com/joho/godotenv" "go.mongodb.org/atlas-sdk/v20250219001/admin" ) func main() { envFile := ".env.production" if err := godotenv.Load(envFile); err != nil { log.Printf("Warning: could not load %s file: %v", envFile, err) } secrets, cfg, err := config.LoadAllFromEnv() if err != nil { log.Fatalf("Failed to load configuration %v", err) } ctx := context.Background() client, err := auth.NewClient(ctx, cfg, secrets) if err != nil { log.Fatalf("Failed to initialize authentication client: %v", err) } // Fetch logs with the provided parameters p := &admin.GetHostLogsApiParams{ GroupId: cfg.ProjectID, HostName: cfg.HostName, LogName: "mongodb", } fmt.Printf("Request parameters: GroupID=%s, HostName=%s, LogName=%s\n", cfg.ProjectID, cfg.HostName, p.LogName) rc, err := logs.FetchHostLogs(ctx, client.MonitoringAndLogsApi, p) if err != nil { log.Fatalf("Failed to fetch logs: %v", err) } defer fileutils.SafeClose(rc) // Prepare output paths // If the ATLAS_DOWNLOADS_DIR env variable is set, it will be used as the base directory for output files outDir := "logs" prefix := fmt.Sprintf("%s_%s", p.HostName, p.LogName) gzPath, err := fileutils.GenerateOutputPath(outDir, prefix, "gz") if err != nil { log.Fatalf("Failed to generate GZ output path: %v", err) } txtPath, err := fileutils.GenerateOutputPath(outDir, prefix, "txt") if err != nil { log.Fatalf("Failed to generate TXT output path: %v", err) } // Save compressed logs if err := fileutils.WriteToFile(rc, gzPath); err != nil { log.Fatalf("Failed to save compressed logs: %v", err) } fmt.Println("Saved compressed log to", gzPath) // Decompress logs if err := fileutils.DecompressGzip(gzPath, txtPath); err != nil { log.Fatalf("Failed to decompress logs: %v", err) } fmt.Println("Uncompressed log to", txtPath) }
提示
有关在所有支柱上实施我们建议的 Terraform 示例,请参阅Github中的以下示例之一:
在使用 Terraform 创建资源之前,您必须:
创建您的付款组织并为该付款组织创建一个 API 密钥。请在终端中运行以下命令,将您的 API 密钥存储为环境变量:
export MONGODB_ATLAS_PUBLIC_KEY="<insert your public key here>" export MONGODB_ATLAS_PRIVATE_KEY="<insert your private key here>"
我们还建议为您的环境创建一个工作区。
配置警报
以下示例演示如何配置警报和警报通知。您必须为每个示例创建以下文件。将每个示例的文件放在各自的目录中。更改 ID 和名称以使用您的值:
variables.tf
variable "atlas_org_id" { type = string description = "MongoDB Atlas Organization ID" } variable "atlas_project_name" { type = string description = "The MongoDB Atlas Project Name" } variable "atlas_project_id" { description = "MongoDB Atlas project id" type = string } variable "atlas_cluster_name" { description = "MongoDB Atlas Cluster Name" default = "datadog-test-cluster" type = string }
terraform.tfvars
atlas_org_id = "32b6e34b3d91647abb20e7b8" atlas_project_name = "Customer Portal - Prod" atlas_project_id = "67212db237c5766221eb6ad9" atlas_cluster_name = "myCluster"
示例:使用以下命令,当存在复制延迟(可能导致数据不一致)时,通过电子邮件向具有 GROUP_CLUSTER_MANAGER角色的用户发送警报通知。
main.tf
resource "mongodbatlas_alert_configuration" "test" { project_id = var.atlas_project_id event_type = "REPLICATION_OPLOG_WINDOW_RUNNING_OUT" enabled = true notification { type_name = "GROUP" interval_min = 10 delay_min = 0 sms_enabled = false email_enabled = true roles = ["GROUP_CLUSTER_MANAGER"] } matcher { field_name = "CLUSTER_NAME" operator = "EQUALS" value = "myCluster" } threshold_config { operator = "LESS_THAN" threshold = 1 units = "HOURS" } }
查看集群指标
运行示例命令以检索以下指标:
OPCOUNTERS - 监控峰值负载下发生的查询、更新、插入和删除的数量,并确保负载不会意外增加。
连接——确保用于成员之间心跳和复制的套接字数量不超过设定的限制。
查询目标 - 确保每秒扫描的键和文档数与返回文档数的平均比率不太高。
SYSTEM CPU - 确保 CPU 使用率保持稳定。
全局锁队列——监控当前排队等待读写锁的读和写入操作数量,并确保负载不会意外增加。
atlas metrics processes atlas-lnmtkm-shard-00-00.ajlj3.mongodb.net:27017 \ --projectId 56fd11f25f23b33ef4c2a331 \ --granularity PT1H \ --period P7D \ --type OPCOUNTER_DELETE,OPCOUNTER_INSERT,OPCOUNTER_QUERY,OPCOUNTER_UPDATE,CONNECTIONS,QUERY_TARGETING_SCANNED_OBJECTS_PER_RETURNED,QUERY_TARGETING_SCANNED_PER_RETURNED,SYSTEM_CPU_GUEST,SYSTEM_CPU_IOWAIT,SYSTEM_CPU_IRQ,SYSTEM_CPU_KERNEL,SYSTEM_CPU_NICE,SYSTEM_CPU_SOFTIRQ,SYSTEM_CPU_STEAL,SYSTEM_CPU_USER,GLOBAL_LOCK_CURRENT_QUEUE_TOTAL,GLOBAL_LOCK_CURRENT_QUEUE_READERS,GLOBAL_LOCK_CURRENT_QUEUE_WRITERS \ --output json
配置警报
运行以下命令,当项目中的连接数可能导致连接风暴时,通过电子邮件向群组发送警报。
atlas alerts settings create \ --enabled \ --event "OUTSIDE_METRIC_THRESHOLD" \ --metricName CONNECTIONS \ --metricOperator LESS_THAN \ --metricThreshold 1 \ --metricUnits RAW \ --notificationType GROUP \ --notificationRole "GROUP_DATA_ACCESS_READ_ONLY","GROUP_CLUSTER_MANAGER","GROUP_DATA_ACCESS_ADMIN" \ --notificationEmailEnabled \ --notificationEmailAddress "user@example.com" \ --notificationIntervalMin 5 \ --projectId 6698000acf48197e089e4085
监控数据库性能
运行以下命令,为检索速度慢的集合检索建议的索引。
atlas performanceAdvisor suggestedIndexes list \ --projectId 56fd11f25f23b33ef4c2a331 \ --processName atlas-zqva9t-shard-00-02.2rnul.mongodb.net:27017
下载日志
运行以下命令下载压缩文件,其中包含项目中指定托管的MongoDB日志。
atlas logs download cluster0-shard-00-00.a1b2c.mongodb.net mongodb.gz
请参阅Atlas架构Go SDK Github存储库中单个项目中的所有Atlas架构中心Go SDK 示例。
在您能够使用 Atlas Go SDK 进行身份验证并运行示例脚本之前,您必须:
创建 Atlas 服务帐户。请在终端中运行以下命令,将您的客户端 ID 和密钥存储为环境变量:
export MONGODB_ATLAS_SERVICE_ACCOUNT_ID="<insert your client ID here>" export MONGODB_ATLAS_SERVICE_ACCOUNT_SECRET="<insert your client secret here>" 在您的 Go 项目中设置以下配置变量:
configs/config.json{ "MONGODB_ATLAS_BASE_URL": "https://cloud.mongodb.com", "ATLAS_ORG_ID": "32b6e34b3d91647abb20e7b8", "ATLAS_PROJECT_ID": "67212db237c5766221eb6ad9", "ATLAS_CLUSTER_NAME": "myCluster", "ATLAS_PROCESS_ID": "myCluster-shard-00-00.ajlj3.mongodb.net:27017" }
有关身份验证和创建客户端的更多信息,请参阅Github中完整的Atlas SDK for Go示例项目。
查看集群指标
以下示例脚本演示如何检索以下指标:
OPCOUNTERS - 监控峰值负载下发生的查询、更新、插入和删除的数量,并确保负载不会意外增加。
连接——确保用于成员之间心跳和复制的套接字数量不超过设定的限制。
查询目标 - 确保每秒扫描的键和文档数与返回文档数的平均比率不太高。
SYSTEM CPU - 确保 CPU 使用率保持稳定。
全局锁队列——监控当前排队等待读写锁的读和写入操作数量,并确保负载不会意外增加。
// See entire project at https://github.com/mongodb/atlas-architecture-go-sdk package main import ( "context" "encoding/json" "fmt" "log" "atlas-sdk-examples/internal/auth" "atlas-sdk-examples/internal/config" "atlas-sdk-examples/internal/metrics" "github.com/joho/godotenv" "go.mongodb.org/atlas-sdk/v20250219001/admin" ) func main() { envFile := ".env.production" if err := godotenv.Load(envFile); err != nil { log.Printf("Warning: could not load %s file: %v", envFile, err) } secrets, cfg, err := config.LoadAllFromEnv() if err != nil { log.Fatalf("Failed to load configuration %v", err) } ctx := context.Background() client, err := auth.NewClient(ctx, cfg, secrets) if err != nil { log.Fatalf("Failed to initialize authentication client: %v", err) } // Fetch process metrics with the provided parameters p := &admin.GetHostMeasurementsApiParams{ GroupId: cfg.ProjectID, ProcessId: cfg.ProcessID, M: &[]string{ "OPCOUNTER_INSERT", "OPCOUNTER_QUERY", "OPCOUNTER_UPDATE", "TICKETS_AVAILABLE_READS", "TICKETS_AVAILABLE_WRITE", "CONNECTIONS", "QUERY_TARGETING_SCANNED_OBJECTS_PER_RETURNED", "QUERY_TARGETING_SCANNED_PER_RETURNED", "SYSTEM_CPU_GUEST", "SYSTEM_CPU_IOWAIT", "SYSTEM_CPU_IRQ", "SYSTEM_CPU_KERNEL", "SYSTEM_CPU_NICE", "SYSTEM_CPU_SOFTIRQ", "SYSTEM_CPU_STEAL", "SYSTEM_CPU_USER", }, Granularity: admin.PtrString("PT1H"), Period: admin.PtrString("P7D"), } view, err := metrics.FetchProcessMetrics(ctx, client.MonitoringAndLogsApi, p) if err != nil { log.Fatalf("Failed to fetch process metrics: %v", err) } // Output metrics out, err := json.MarshalIndent(view, "", " ") if err != nil { log.Fatalf("Failed to format metrics data: %v", err) } fmt.Println(string(out)) }
下载日志
以下示例脚本演示了如何下载和解压缩包含您 Atlas 项目中指定托管的 MongoDB 日志的压缩文件:
// See entire project at https://github.com/mongodb/atlas-architecture-go-sdk package main import ( "context" "fmt" "log" "atlas-sdk-examples/internal/auth" "atlas-sdk-examples/internal/config" "atlas-sdk-examples/internal/fileutils" "atlas-sdk-examples/internal/logs" "github.com/joho/godotenv" "go.mongodb.org/atlas-sdk/v20250219001/admin" ) func main() { envFile := ".env.production" if err := godotenv.Load(envFile); err != nil { log.Printf("Warning: could not load %s file: %v", envFile, err) } secrets, cfg, err := config.LoadAllFromEnv() if err != nil { log.Fatalf("Failed to load configuration %v", err) } ctx := context.Background() client, err := auth.NewClient(ctx, cfg, secrets) if err != nil { log.Fatalf("Failed to initialize authentication client: %v", err) } // Fetch logs with the provided parameters p := &admin.GetHostLogsApiParams{ GroupId: cfg.ProjectID, HostName: cfg.HostName, LogName: "mongodb", } fmt.Printf("Request parameters: GroupID=%s, HostName=%s, LogName=%s\n", cfg.ProjectID, cfg.HostName, p.LogName) rc, err := logs.FetchHostLogs(ctx, client.MonitoringAndLogsApi, p) if err != nil { log.Fatalf("Failed to fetch logs: %v", err) } defer fileutils.SafeClose(rc) // Prepare output paths // If the ATLAS_DOWNLOADS_DIR env variable is set, it will be used as the base directory for output files outDir := "logs" prefix := fmt.Sprintf("%s_%s", p.HostName, p.LogName) gzPath, err := fileutils.GenerateOutputPath(outDir, prefix, "gz") if err != nil { log.Fatalf("Failed to generate GZ output path: %v", err) } txtPath, err := fileutils.GenerateOutputPath(outDir, prefix, "txt") if err != nil { log.Fatalf("Failed to generate TXT output path: %v", err) } // Save compressed logs if err := fileutils.WriteToFile(rc, gzPath); err != nil { log.Fatalf("Failed to save compressed logs: %v", err) } fmt.Println("Saved compressed log to", gzPath) // Decompress logs if err := fileutils.DecompressGzip(gzPath, txtPath); err != nil { log.Fatalf("Failed to decompress logs: %v", err) } fmt.Println("Uncompressed log to", txtPath) }
提示
有关在所有支柱上实施我们建议的 Terraform 示例,请参阅Github中的以下示例之一:
在使用 Terraform 创建资源之前,您必须:
创建您的付款组织并为该付款组织创建一个 API 密钥。请在终端中运行以下命令,将您的 API 密钥存储为环境变量:
export MONGODB_ATLAS_PUBLIC_KEY="<insert your public key here>" export MONGODB_ATLAS_PRIVATE_KEY="<insert your private key here>"
我们还建议为您的环境创建一个工作区。
配置警报
以下示例演示如何配置警报和警报通知。您必须为每个示例创建以下文件。将每个示例的这些文件放在各自的目录中,并仅替换 main.tf文件。更改 ID 和名称以使用您的值:
variables.tf
variable "atlas_org_id" { type = string description = "MongoDB Atlas Organization ID" } variable "atlas_project_name" { type = string description = "The MongoDB Atlas Project Name" } variable "atlas_project_id" { description = "MongoDB Atlas project id" type = string } variable "atlas_cluster_name" { description = "MongoDB Atlas Cluster Name" default = "datadog-test-cluster" type = string } variable "datadog_api_key" { description = "Datadog api key" type = string } variable "datadog_region" { description = "Datadog region" default = "US5" type = string } variable "prometheus_user_name" { type = string description = "The Prometheus User Name" default = "puser" } variable "prometheus_password" { type = string description = "The Prometheus Password" default = "ppassword" }
terraform.tfvars
atlas_org_id = "32b6e34b3d91647abb20e7b8" atlas_project_name = "Customer Portal - Prod" atlas_project_id = "67212db237c5766221eb6ad9" atlas_cluster_name = "myCluster" datadog_api_key = "1234567890abcdef1234567890abcdef" datadog_region = "US5" prometheus_user_name = "prometheus_user" prometheus_password = "secure_prometheus_password"
示例 1:使用以下内容与 Datadog 和 Prometheus 等第三方服务集成,以发出警报通知。
main.tf
resource "mongodbatlas_third_party_integration" "test_datadog" { project_id = var.atlas_project_id type = "DATADOG" api_key = var.datadog_api_key region = var.datadog_region } resource "mongodbatlas_third_party_integration" "test_prometheus" { project_id = var.atlas_project_id type = "PROMETHEUS" user_name = var.prometheus_user_name password = var.prometheus_password service_discovery = "http" enabled = true } output "datadog.id" { value = mongodbatlas_third_party_integration.test_datadog.id } output "prometheus.id" { value = mongodbatlas_third_party_integration.test_prometheus.id }
示例 2:当副本集上没有主节点 (primary node in the replica set)超过 5 分钟时,使用以下命令向 Datadog 和 Prometheus 等第三方服务发送警报通知。
main.tf
resource "mongodbatlas_alert_configuration" "test_alert_notification" { project_id = var.atlas_project_id event_type = "NO_PRIMARY" enabled = true notification { type_name = "PROMETHEUS" integration_id = mongodbatlas_third_party_integration.test_datadog.id # ID of the Atlas Prometheus integration } notification { type_name = "DATADOG" integration_id = mongodbatlas_third_party_integration.test_prometheus.id # ID of the Atlas Datadog integration } matcher { field_name = "REPLICA_SET_NAME" operator = "EQUALS" value = "myReplSet" } threshold_config { operator = "GREATER_THAN" threshold = 5 units = "MINUTES" } }
示例 3:当存在复制延迟(可能导致数据不一致)时,使用以下命令通过电子邮件向具有 GROUP_CLUSTER_MANAGER角色的用户发送警报通知。
main.tf
resource "mongodbatlas_alert_configuration" "test_replication_lag_alert" { project_id = var.atlas_project_id event_type = "OUTSIDE_METRIC_THRESHOLD" enabled = true notification { type_name = "GROUP" interval_min = 10 delay_min = 0 sms_enabled = false email_enabled = true roles = ["GROUP_CLUSTER_MANAGER"] } matcher { field_name = "CLUSTER_NAME" operator = "EQUALS" value = "myCluster" } metric_threshold_config { metric_name = "OPLOG_SLAVE_LAG_MASTER_TIME" operator = "GREATER_THAN" threshold = 1 units = "HOURS" } }