MongoDB Atlas ships with a large set of built-in alerts, but many teams turn them on without being fully clear on what each one is actually telling them. The result is predictable: either alert fatigue or missed signals.
This guide focuses on a small set of alerts that consistently map to real production issues. The goal isn’t just to define the metrics, but to explain what they usually mean in a running system, what tends to trigger them, and where to look first when they fire.
If you only configure a handful of alerts, start with these five:
Query Targeting
Normalized CPU
Connections %
System Memory %
Host Down
Together, they cover most real-world failure modes and give you a clean starting point for debugging.
For the full breakdown with additional context and code snippets, read the complete article on Medium.
Query Targeting
Query targeting is one of the most valuable alerts because it surfaces inefficiency early, before it turns into a visible performance issue.
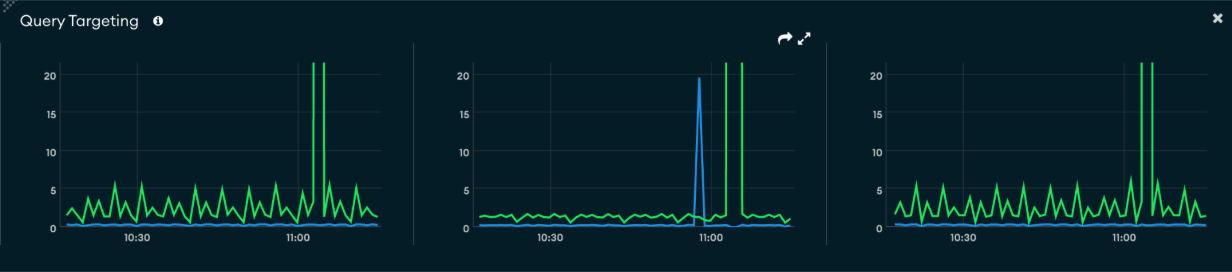
At a high level, it measures how much work MongoDB is doing compared to how much data your queries actually return. In practical terms, it answers a simple question: are your queries going straight to the data they need, or scanning through large portions of the collection to find it?
If a query returns a handful of documents but scans thousands to get there, the database is doing unnecessary work—and that inefficiency compounds quickly as traffic grows.
This alert tends to show up before anything else. You’ll often see targeting ratios degrade before CPU increases or latency starts to move, which makes it a strong early warning signal.
When it fires, start with context before jumping to fixes:
Did a new query or feature get deployed?
Did traffic patterns change?
Is this isolated to one collection or more widespread?
Once you’ve scoped the issue, move into the tools that show actual query behavior:
Query Profiler to identify slow or inefficient queries
Performance Advisor for missing or weak indexes
Namespace Insights to see where the load is concentrated
From there, drop down to explain() to confirm what MongoDB is doing. You’re typically looking for:
Collection scans (COLLSCAN)
Large numbers of documents examined
Expensive sorting stages
Most fixes come back to indexing and query shape. That usually means:
Adding indexes that match real query patterns
Using compound indexes for filter + sort
Tightening filters or avoiding unbounded queries
The key mindset shift is that this alert isn’t the diagnosis—it’s the pointer to inefficient queries.
Normalized CPU
Normalized CPU shows how much CPU your cluster is using, scaled from 0 to 100 percent based on available cores.
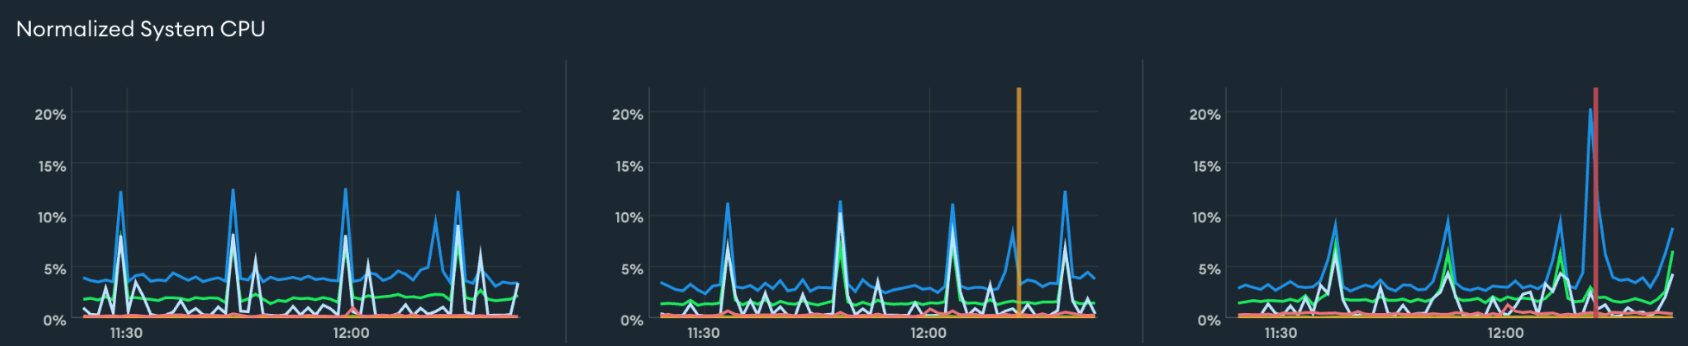
In practical terms, this tells you how busy your database is doing actual work. When CPU is high, MongoDB is actively processing queries—scanning, sorting, and running aggregations—not waiting on I/O.
Short spikes are normal. What matters is sustained usage. If the CPU remains high over time, the system is under continuous pressure.
That pressure usually comes from one of two places:
Queries are inefficient and do too much work
The workload has outgrown the cluster’s capacity
The alert doesn’t tell you which—it just tells you the system is busy.
When it fires, start by understanding the pattern:
Is usage constant or tied to specific jobs?
Did traffic increase, or did query shape change?
Are slow queries appearing at the same time?
From there, use the same investigation flow:
Query Profiler to find expensive operations
Performance Advisor for indexing gaps
Namespace Insights to identify hot collections
At the query level, explain() helps confirm what’s driving CPU usage:
Large scans or high document examination
In-memory sorts or heavy aggregations
In most cases, it’s worth improving efficiency before scaling. Optimizing queries and indexes can significantly reduce CPU usage. If the workload is already efficient, then scaling becomes the right next step—either increasing cluster size or distributing the load.
A useful way to think about this alert is that it tells you the system is working hard, but not whether it should be.
Connections %
Connection percentage tells you how close your cluster is to its maximum allowed number of client connections.
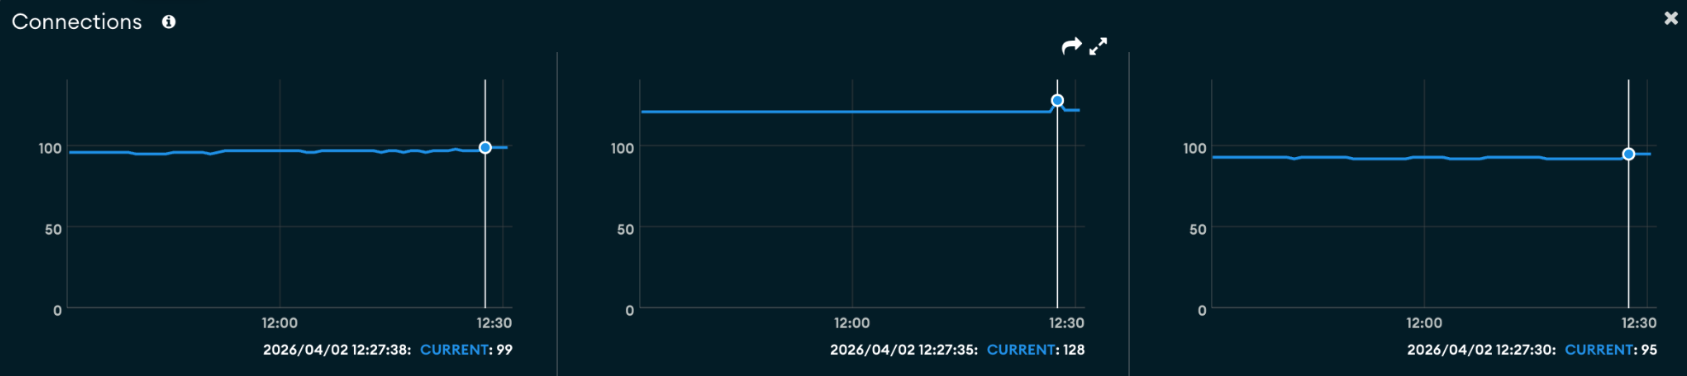
This is a capacity signal, not a query efficiency signal. It answers a straightforward question: Are you running out of room for new connections?
This matters because connection limits tend to fail abruptly. Once the limit is reached, new connections are rejected, which usually shows up as application errors rather than gradual degradation.
When this alert fires, the first thing to look at is how the connection count changed:
A sudden spike often points to a deployment, traffic surge, or scaling event
A steady climb that doesn’t drop back down usually indicates a structural issue
In many cases, the root cause sits in the application layer. Common patterns include:
Creating a new database client per request
Oversized connection pools per service instance
Horizontal scaling multiplies total connections
Connections are not being released properly
To understand what’s happening, correlate connection trends with application behavior:
Did the system scale out?
Did a new service or worker get introduced?
Do connections persist longer than expected?
Fixes typically fall into three areas:
Connection handling: use proper pooling and reuse clients
Pool sizing: reduce per-instance pool sizes where needed
Capacity: upgrade cluster tier if the workload is legitimate
If you’re already near the limit, short-term actions like restarting applications can reduce pressure—but they won’t fix the underlying issue.
This alert is a good reminder that many “database problems” are really about how the application interacts with the database.
System Memory %
System memory percent shows how much of the host machine’s RAM is currently in use.
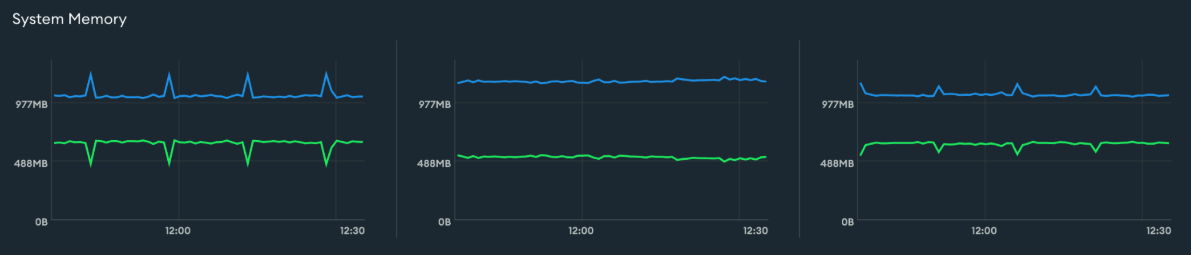
MongoDB is designed to use memory aggressively. The more of your working set—the active portion of your data—that fits in RAM, the faster queries will be. Once memory becomes constrained, the system relies more on disk, and performance starts to shift. The Atlas metrics documentation is useful for seeing how memory and disk behavior line up.
That shift usually shows up as:
Increased disk reads
Slower query response times
Because of this, memory alerts are best interpreted in context. High memory usage alone isn’t necessarily a problem. What matters is whether it’s sustained and whether it correlates with other signals.
When this alert fires, start with trends:
Has memory usage been consistently high?
Is it increasing over time?
Then look for changes:
Did the dataset or index size grow?
Did traffic increase?
Did a new workload or aggregation job start?
The key correlation to watch is memory and disk together. If disk reads increase alongside memory pressure, it’s a strong signal that your working set no longer fits in RAM.
From there, move into query-level analysis:
Use the Query Profiler to identify operations reading large portions of data
Look for queries or aggregations that require significant in-memory processing
Fixes can happen at multiple levels:
Query-level: improve indexing, reduce scanned data, avoid large in-memory operations
Data-level: archive cold data, remove unused indexes, reduce document size
Capacity: scale up for more RAM or shard to distribute data
This alert is less about absolute usage and more about whether your data comfortably fits in memory.
Host Down
A Host Down alert means a node in your cluster was unreachable at a specific moment in time. Atlas expected to communicate with it and couldn’t—it doesn’t explain why, just that the node wasn’t reachable when checked.
In practice, this usually comes down to:
A node restart
Host or infrastructure issues
Network disruption
Because this is based on periodic checks, it’s a snapshot. The node may have already recovered by the time you investigate.
When it fires, start with context:
Did this align with a deployment, scaling event, or traffic spike?
Are there events like a primary election or a restart?
Then check metrics to understand impact:
Connection drops and recovery
Latency spikes
Throughput dips
Finally, look just before the event for signals like CPU, memory, or connection pressure to understand what led up to it.
Unlike the other alerts, this is a direct point-in-time availability signal, not an early warning.
How to use these alerts effectively
Across all of these alerts, the workflow is consistent.
An alert fires, and instead of treating it as an answer, you treat it as a direction. From there, you move into the tools that explain what’s actually happening—Query Profiler, Metrics, Performance Advisor, and query plans.
Over time, you’ll also tune thresholds so alerts fire early enough to act on, but not so early that they become noise.
Final takeaway
Each of these alerts points to a different problem space:
Query Targeting → inefficient queries
CPU → compute pressure
Connections → application behavior
Memory → working set pressure
Host Down → availability
Used this way, alerts stop being noisy dashboard signals and become a structured way to understand what’s happening in your system—and where to look next.
If you set up just these five and learn how to interpret them, you’ll catch most issues before they turn into incidents.
Deep Dive
For the full breakdown with additional context and code snippets, read the complete article on Medium.