In July 2025, MongoDB introduced Query Shape Insights for MongoDB Atlas. This feature provides customers with powerful tools to understand query performance trends at a granular level. Almost immediately upon launch, enterprise customers asked an important question: “Can we view these insights directly in Datadog, where we already monitor our applications?”
MongoDB recognizes that developers and IT teams depend on centralized, unified visibility to ensure application reliability and uptime at scale. To address this necessity, MongoDB is strengthening its observability suite and partnership with Datadog, one of the most widely adopted observability platforms among MongoDB customers.
MongoDB is proud to announce the expansion of its Datadog integration with the addition of query shape metrics from MongoDB Atlas. This new capability delivers greater query performance visibility and builds upon the existing MongoDB Atlas telemetry collected by Datadog. This empowers customers to monitor and optimize databases alongside applications with greater precision.
Turning insights into action
Previously, Datadog customers could monitor overall MongoDB Atlas cluster health. However, query performance visibility at the shape level was absent. Identifying deteriorating performance required users to toggle between MongoDB Atlas and Datadog. This created delays and blind spots that hindered rapid problem identification and resolution.
Query Shape Insights in Datadog delivers customers the following benefits:
- Seamless integration: Push query shape metrics directly into Datadog’s observability stack.
Unified visibility: Correlate query shape metrics with database and hardware telemetry to contextualize workload impact on performance.
Rich performance metrics: Capture detailed statistics, such as execution time, documents returned, execution frequency, and more.
Drill-down analysis: Explore individual query shapes with metadata and investigate trending performance insights.
These combined capabilities enable customers to move from detection to resolution with increased speed and clarity. This is essential in dynamic environments where application behavior evolves rapidly and bottlenecks can lead to service outages and lost revenue.
Looking inside the integration
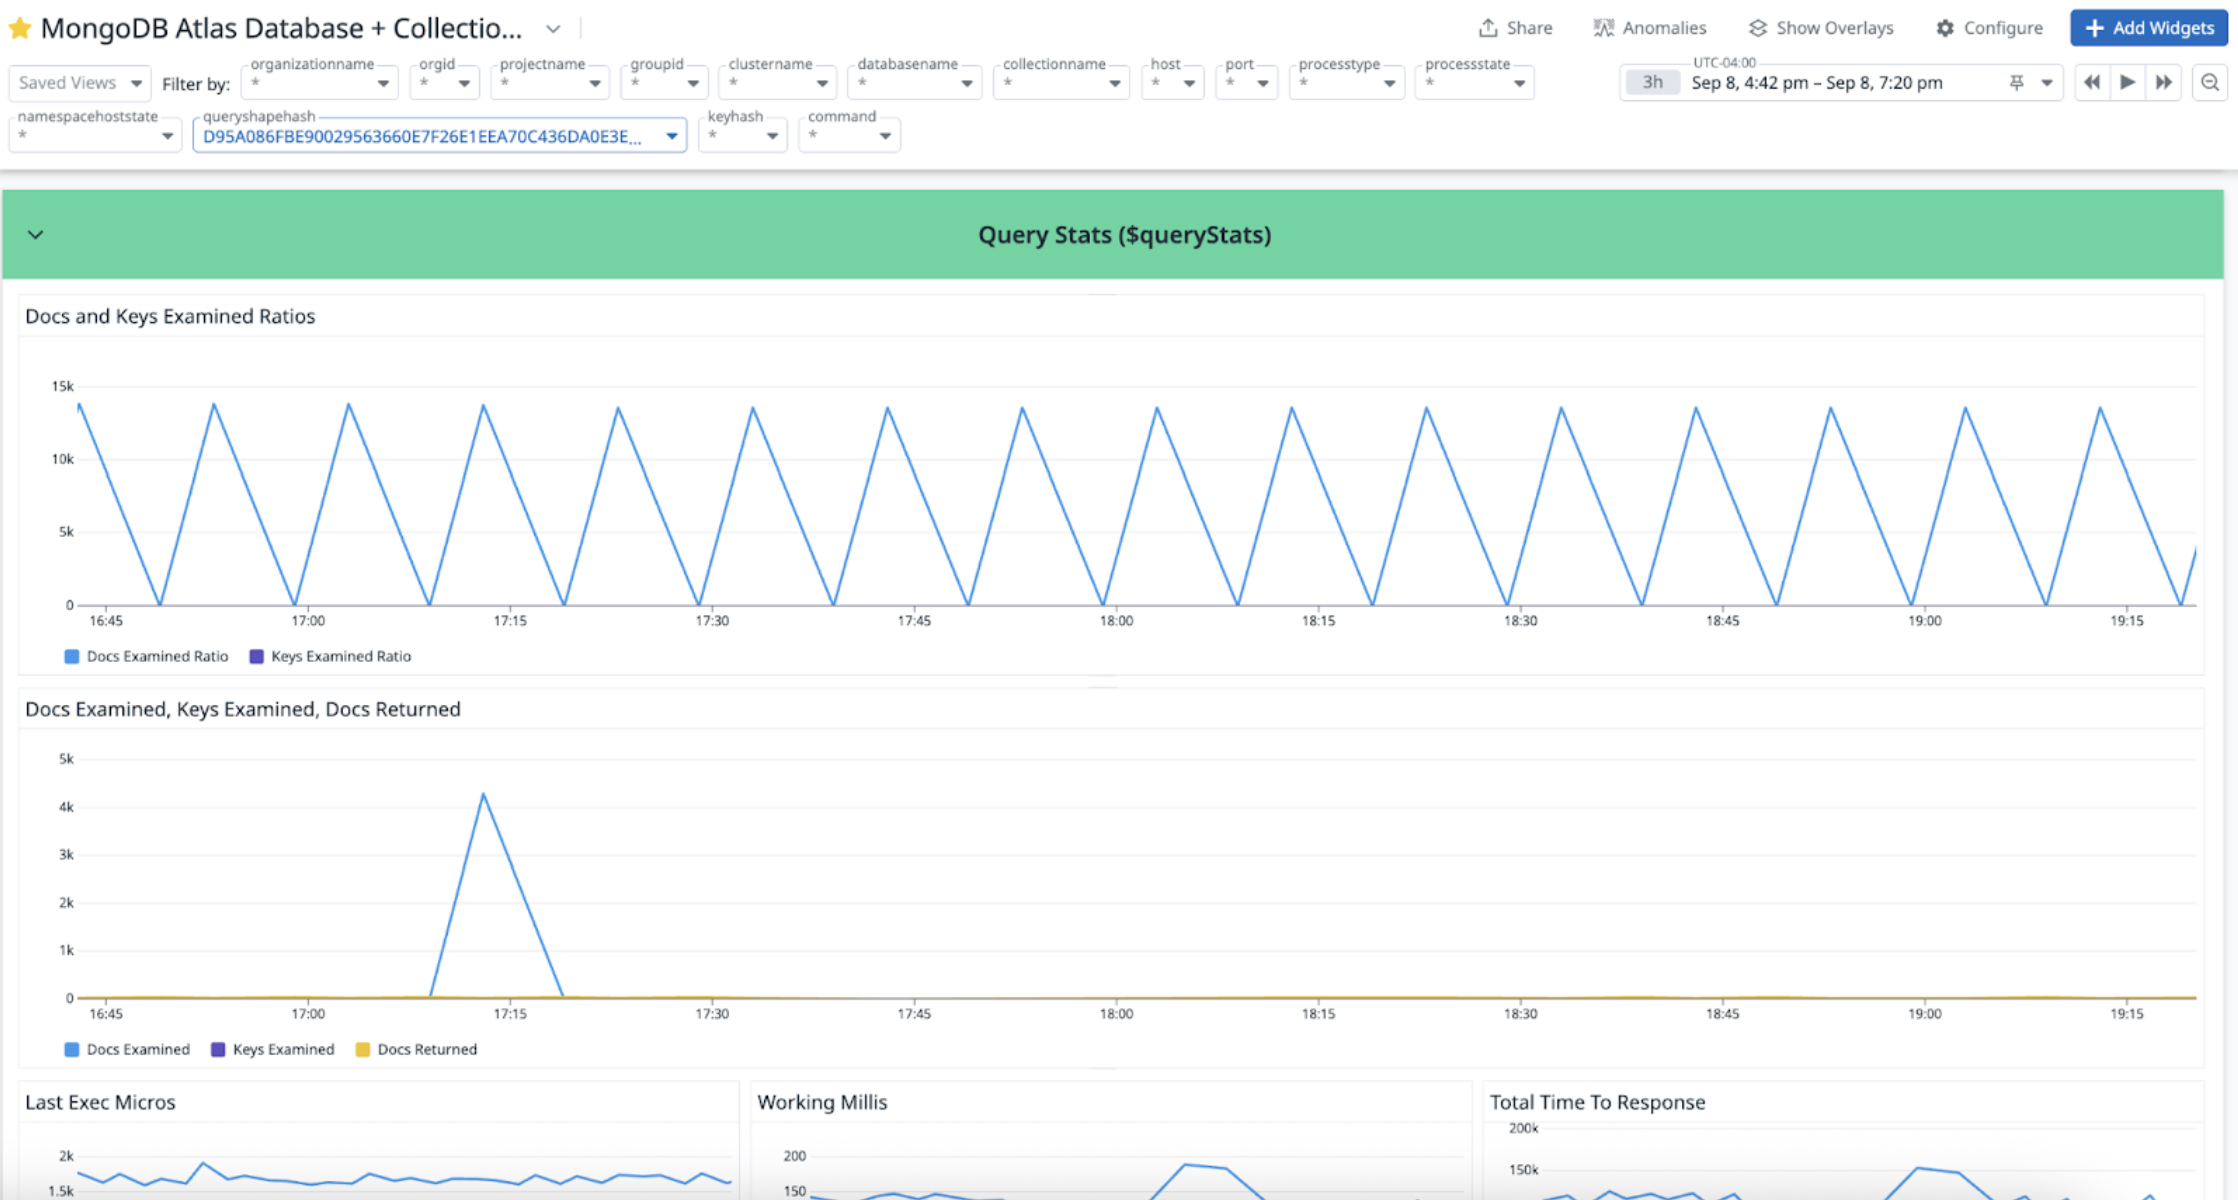
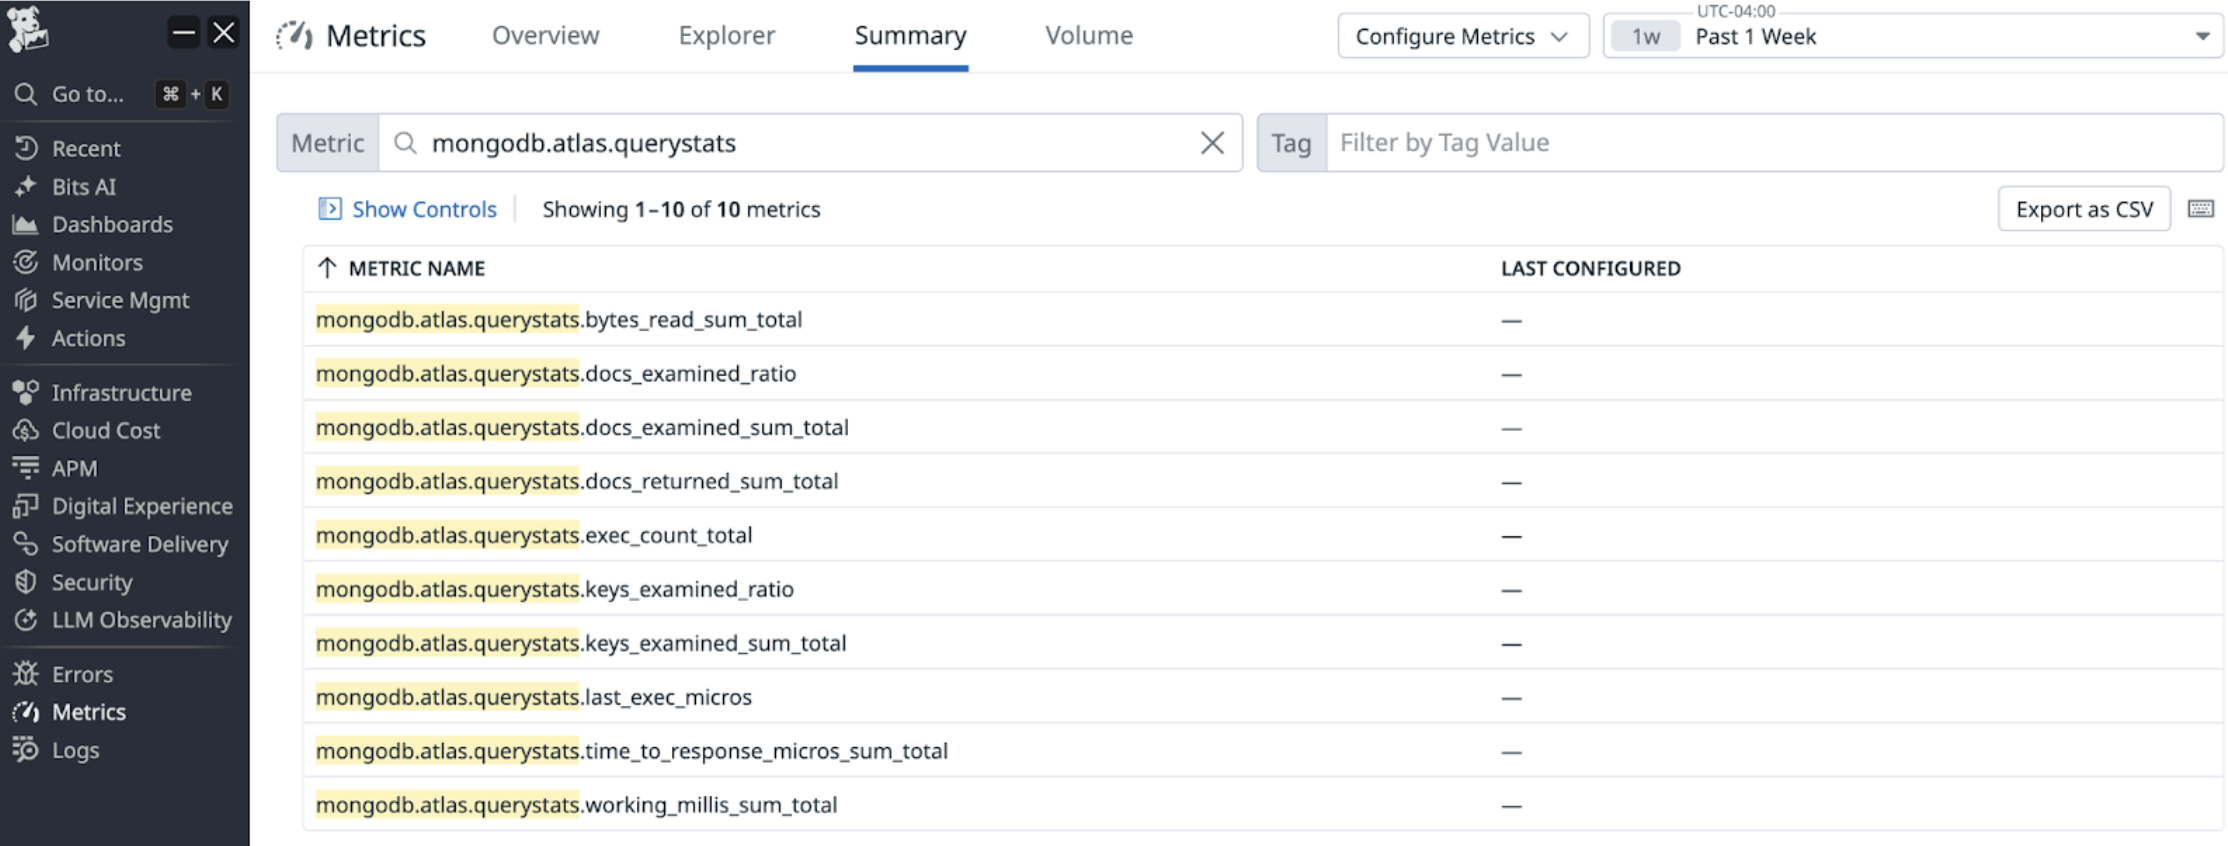
Expanding MongoDB Atlas Query Shape Insights into Datadog provides customers with granular visibility into query performance directly in the observability platform. Each query shape is enriched with fine-grained metrics. These include, but are not limited to:
Total execution time
Average execution time
Execution count
Keys examined
Documents examined
Documents returned
Total time to response
With the ability to track performance trends over time with these metrics, customers can rapidly pinpoint regressions.
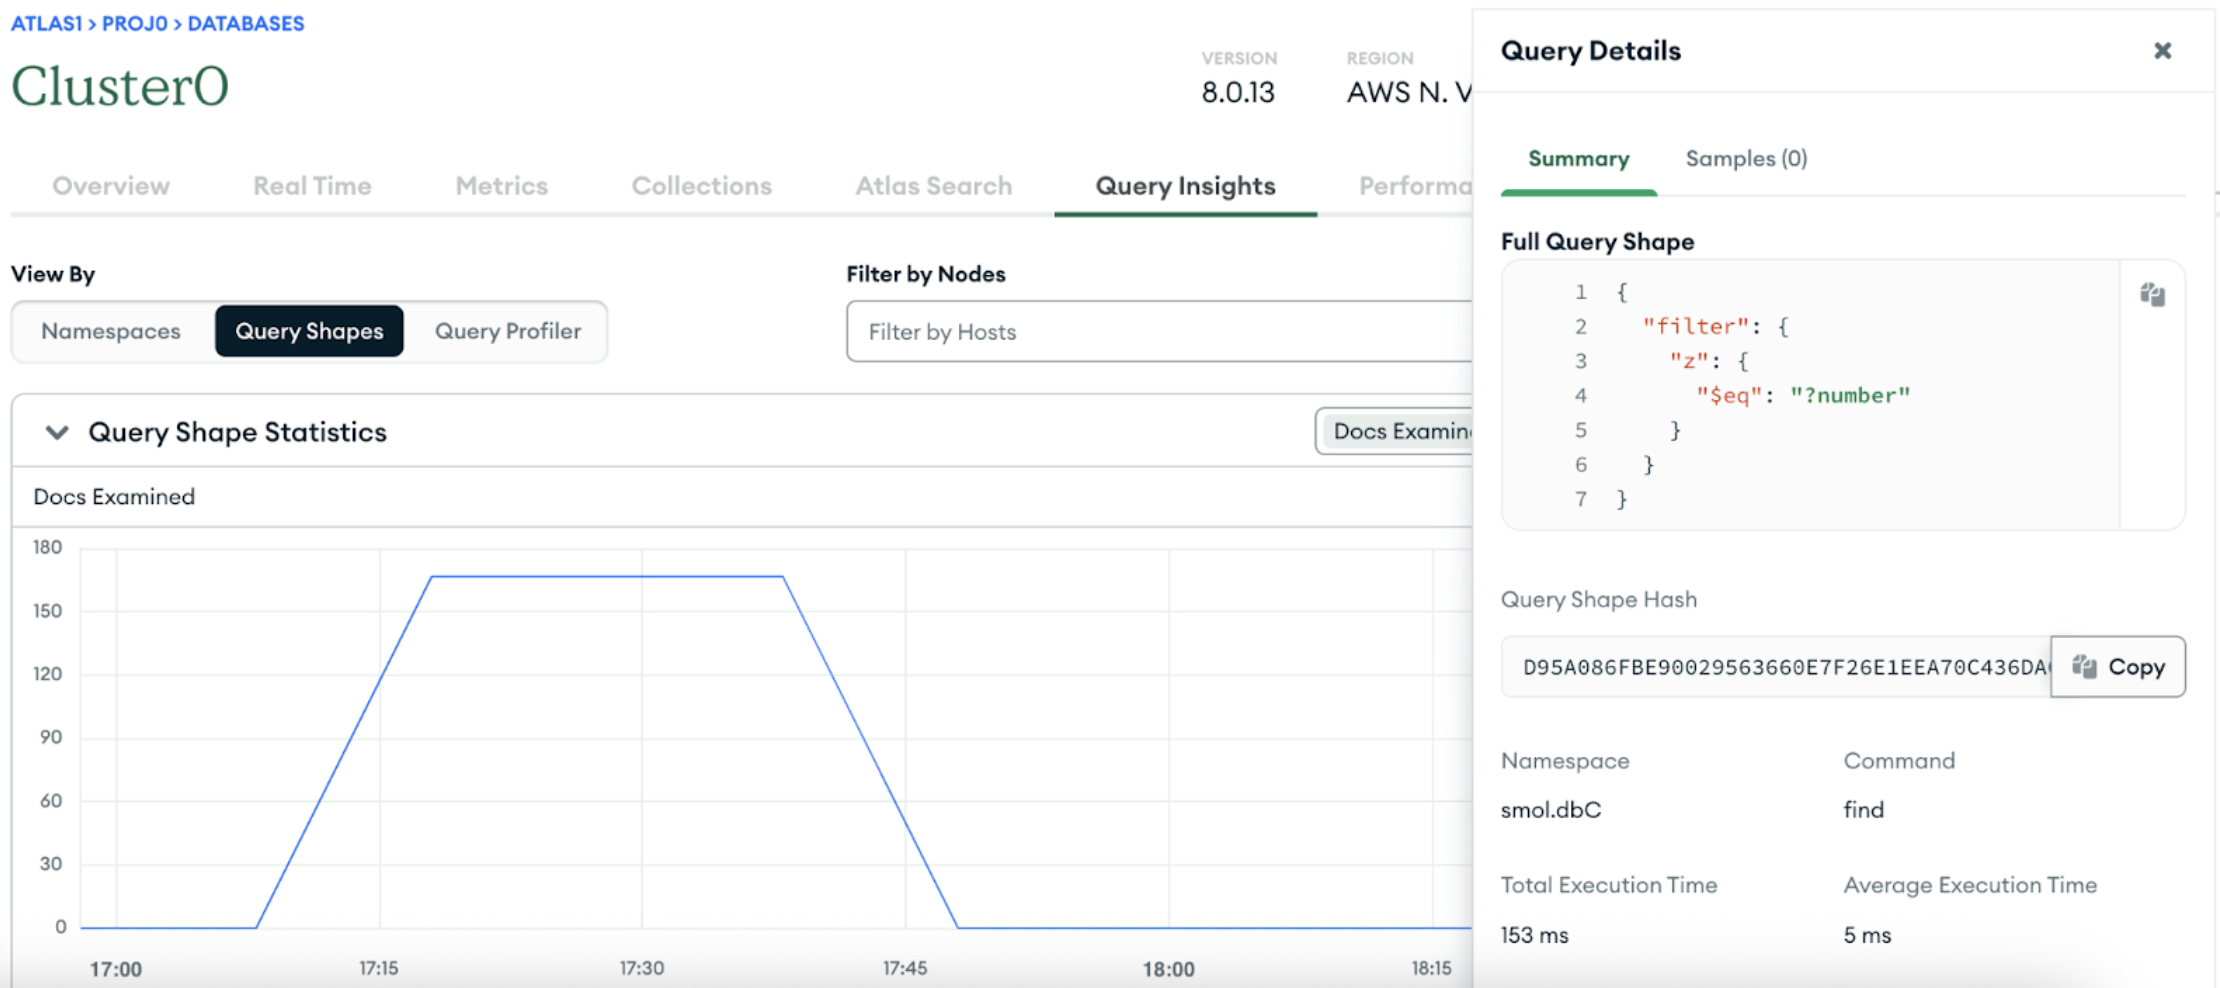
Query metrics flow into Datadog with a new queryshapehash tag. This enables simple correlation to database activity from application and infrastructure signals. Customers can then cross-reference the hash with details in the MongoDB Atlas UI, slow logs, or a public API endpoint for deeper analysis.
The integration is opt-in by default, ensuring customers maintain control. Query shapes are hashed rather than sent in plain text to protect sensitive information. Configuration is flexible and can be managed through the MongoDB Atlas UI and the MongoDB Atlas Administration API, as well as through Terraform or AWS CloudFormation. The integration logs all changes in the Activity Feed to support compliance and alerting requirements.
Building a stronger partnership
This integration underscores MongoDB and Datadog’s shared commitment to delivering customers actionable insights without disrupting existing workflows. Organizations can seamlessly monitor database performance, application health, and infrastructure metrics in a single, unified view by combining MongoDB’s data platform with Datadog’s leading observability and security platform.
“Understanding how queries behave in real time is critical to maintaining reliability and performance. By bringing MongoDB query shape metrics directly into Datadog, teams can correlate database activity with application and infrastructure signals in real time, making it easier to spot bottlenecks and optimize systems at scale,” said Jimmy Caputo, Director of Product at Datadog.
This visibility enables customers to proactively identify performance bottlenecks, optimize queries, and maintain high availability. Without context switching between tools or building custom integrations. MongoDB and Datadog empower IT operations and engineering teams to move faster, operate with confidence, and scale modern applications while ensuring user experiences remain smooth and reliable.
Next Steps
Start streaming query shape metrics in Datadog today. Read the docs.