Analyzing unstructured data requires specialized tools that can process diverse formats, handle large volumes, and reveal meaningful insights. These tools bridge the gap between raw, unorganized information—such as social media posts, IoT sensor data, and video files—and actionable intelligence for decision-making. Each tool offers unique features, strengths, and use cases, allowing businesses to choose solutions tailored to their data analytics needs.
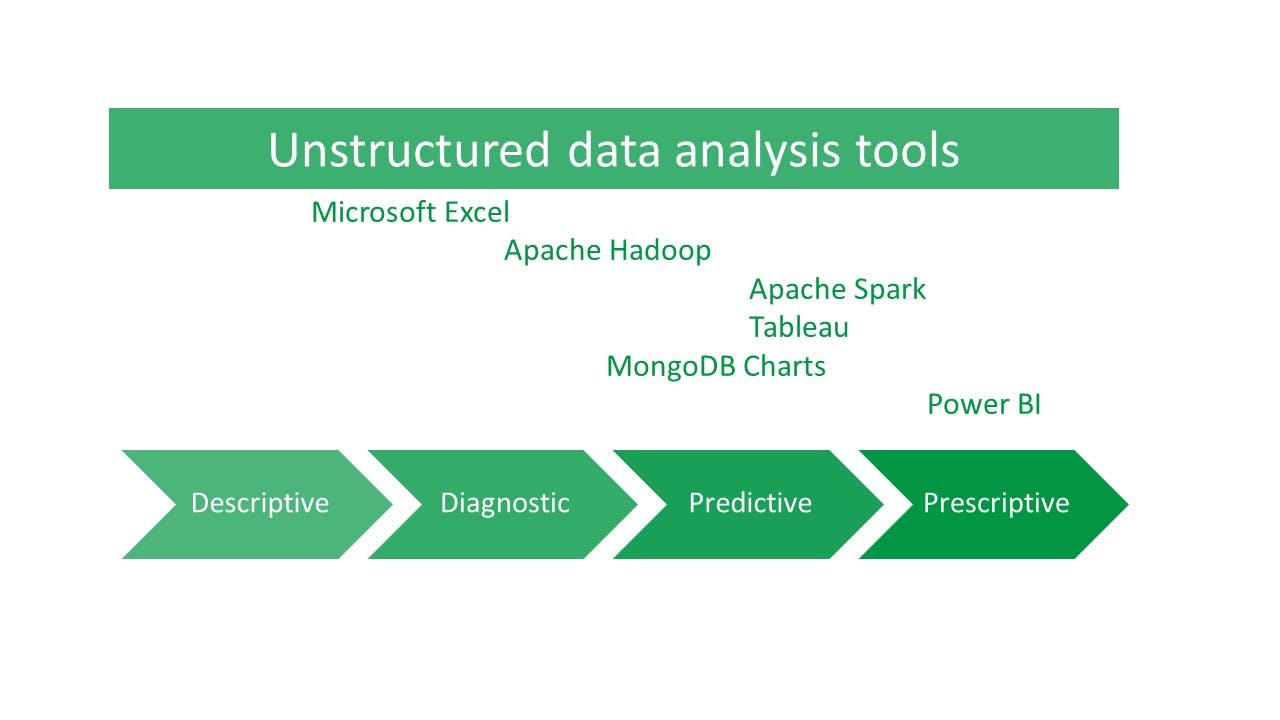
From platforms like MongoDB Charts that excel at visualizing JSON data, to Apache Hadoop and Spark for processing large-scale datasets, these tools empower organizations to transform unstructured data into valuable insights. Business intelligence tools like Tableau and Power BI enhance accessibility for non-technical users, enabling intuitive visualizations and real-time reporting. Even widely-used solutions like Microsoft Excel play a role in integrating and analyzing smaller datasets.
Below is a curated list of the most effective tools for unstructured data analytics, detailing their key capabilities and how they can address diverse business challenges. Whether you’re managing customer feedback, performing sentiment analysis, or building predictive models, these tools can unlock the potential hidden in your unstructured data sources.
MongoDB Charts
MongoDB Charts is an easy way to analyze data stored in MongoDB.
Key features: Native integration with JSON data, real-time dashboards, embedded analytics, and collaboration capabilities
Strengths: Ideal to store unstructured data in MongoDB, eliminating the need for ETL processes
Use cases: Real-time analytics, self-service reporting, and data-driven decision-making
Microsoft Excel
Most of us have used MS Excel at some point to store data, perform basic calculations, and run descriptive analytics. (You can import unstructured data from NoSQL databases like MongoDB using BI connector to bring unstructured data into Excel.)
Key features: Pivot tables, advanced formulas, and Visual Basic scripting
Strengths: Suitable for medium-sized datasets; integrates unstructured data via connectors
Use cases: Marketing analysis, employee record management, and report generation
Excel cannot handle extremely large datasets (more than one million rows). For this, you can use MongoDB to store large amounts of data.
Apache Hadoop
The Apache Hadoop ecosystem is an entire set of modules working together to divide an application into smaller fractions that run on multiple nodes.
Key features: Distributed parallel processing and fault tolerance
Strengths: Processes large-scale batch data; integrates with real-time systems like Apache Spark
Use cases: Supply chain management, public health trend analysis, and customer data insights
Hadoop handles heavy batch operations but is not suitable to deal with real-time data. To overcome this, you can:
- Use Hadoop with Apache Spark: Spark is lightning fast for processing real-time data.
- Using both tools together ensures batch and real-time processing for applications.
- Use Hadoop with MongoDB to support real-time expressive ad hoc queries and aggregations against the data.
Apache Spark
Spark supports different data analytics tasks, like data loading and transformation, machine learning, graph processing, and streaming computation.
Key features: In-memory processing, machine learning pipelines, and diverse data ingestion
Strengths: Handles real-time and streaming data for applications like fraud detection and personalized recommendations
Use cases: Product recommendation engines, log analysis, and sentiment analysis
Tableau
Tableau is an end-to-end data analytics and self-service business intelligence tool that helps businesses to integrate data, analyze, visualize, and share data insights.
Key features: Drag-and-drop interface, advanced visualizations, and intelligent blending of data sources
Strengths: Empowers non-technical users to create interactive dashboards with unstructured data from non-relational databases
Use cases: Data visualization, trend spotting, and strategic planning
Power BI
Power BI is a powerful self-service BI tool that can perform unstructured data analytics.
Key features: Natural language querying, Power Query for data transformation, and rich DAX expressions
Strengths: Seamlessly integrates with cloud platforms; ideal for real-time and ad hoc reporting
Use cases: Resource management, inventory optimization, and sales performance tracking