Time series data is generated everywhere from social media to stock tickers to IoT devices. Analyzing time series data enables organizations to detect, prevent, and predict events ahead of their competition. But where should the ever-increasing volume of time series data be stored? And how can it be analyzed?
MongoDB added native support for time series data in version 5.0. In this article, you'll learn what time series data is, how you can store and query time series data in MongoDB, and what the best practices are for working with time series data in MongoDB.
What is Time Series Data?
Time series data are measurements taken at time intervals from one or more sources.
While not all data is time series in nature, a growing percentage of it can be classified as time series. Nearly every company needs to query, analyze, and report on time series data. Consider a stock day trader constantly looking at feeds of stock prices over time and running algorithms to analyze trends to identify opportunities. They are looking at data over a time interval with hourly or daily ranges. Another example could be how a connected weather measurement device might obtain telemetry such as humidity levels and temperature change to forecast weather. Additionally, it could monitor air pollution to produce alerts or analysis before a crisis occurs. The gathered information can be looked at over a time range to calculate trends over time.
Here is a single document example of a stock trading measurement:
Generally, time series data includes the time and measurement, as well as other identifying information such as the source of the data. In this example of time series data that captures stock trading information, we have the date as the time classifier and the stock symbol as the identification field while information like open and close prices are the measurements in this case.
Time Series Data in MongoDB
When you work with time series data, you are often not only concerned with storing the data but also require high read and write performance and advanced query capabilities. MongoDB is a document-based general purpose database with flexible schema design and a rich query language. As of MongoDB 5.0, MongoDB natively supports time series data.
You can create a new time series collection with the createCollection() command. When you want to create a time series collection, you must include the timeField option. timeField indicates the name of the field that includes the date in each document. You should also include the following options:
The metaField indicates the name of the field that contains metadata in each document. The metaField serves as a label or tag which allows time series collections to uniquely identify the source of a time series. This field should never or rarely change over time.
The granularity field indicates the time span between documents with a matching metaField, if specified. The default granularity is "seconds" which indicates a high-frequency ingestion rate as it relates to each unique time series identified by the metaField. Granularity can be set to "seconds," "minutes," or "hours," and can be modified to be coarser at any time. However, you cannot modify granularity to be finer, e.g., "minutes" to "seconds," so it is recommended to start at a finer granularity and adjust to a coarser granularity.
Lastly, you may want to include this option if you would like to remove data after a certain time has passed:
The expireAfterSeconds field indicates the number of seconds after which documents should expire and be automatically deleted.
The following example creates a time series collection named dowJonesTickerData where the timeField is date and the metaField is symbol:
Each document that you add to the time series collection will need to specify at least the timeField. In the example document below, the timeField is date. Note that, timeField can be named anything as long as it is of BSON type, Date. A document can be added to a time series collection using any of the methods that can be used to insert documents into other MongoDB collections. The example below adds a document to the dowJonesTickerData collection using .
Each measurement inserted should be a single measurement, either as individual documents or batches of documents with one measure per document. MongoDB will optimize this data stored by time to reduce size footprint and optimize time series access patterns and write throughput.
How Do I Retrieve Time Series Data in MongoDB?
Documents in time series collections can be queried in the same ways documents in other MongoDB collections can. For example, we can query in the MongoDB Shell, mongosh, for a document in the dowJonesTickerData collection using findOne().
The MongoDB shell will return one document:
MongoDB optimizes the data, as it stores data ordered by time as opposed to the natural order in regular collections.
You can improve query performance by adding secondary indexes on the metaField and/or the timeField.
If you want to enable search on multiple metadata fields (e.g., symbol and company), we recommend updating your data model. Instead of the metaField being a single value (e.g., symbol), update the metaField to be an object that contains multiple pieces of metadata.
For example, let's drop our existing dowJonesTickerData collection and create a new one that has a metaField named "meta."
Next, let's insert a document that stores multiple pieces of metadata in the meta field.
Now, we can create a secondary index that has multiple fields. In our case, we will create a secondary index that allows for efficient searching of both symbol and company.
Cleaning Up Documents
It's common that time series data might not be relevant after a certain time period. Purging or archiving old data keeps the collection as small as possible, thereby improving performance and reducing cost.
Automatically Deleting Time Series Documents
The recommended way to automatically delete expired data is by setting a TTL, Time To Live expression, on a time series collection in the form of an expireAfterSeconds parameter. Data will be removed after a document date value reaches “now - expireAfterSeconds.”
In the example above, a document will be deleted after the value stored in the date field is three years old.
You can set or modify this parameter at any point during or after collection creation, so if your requirements change around your data lifecycle, you can easily modify or update the Time to Live for your data.
Automatically Archiving Time Series Documents
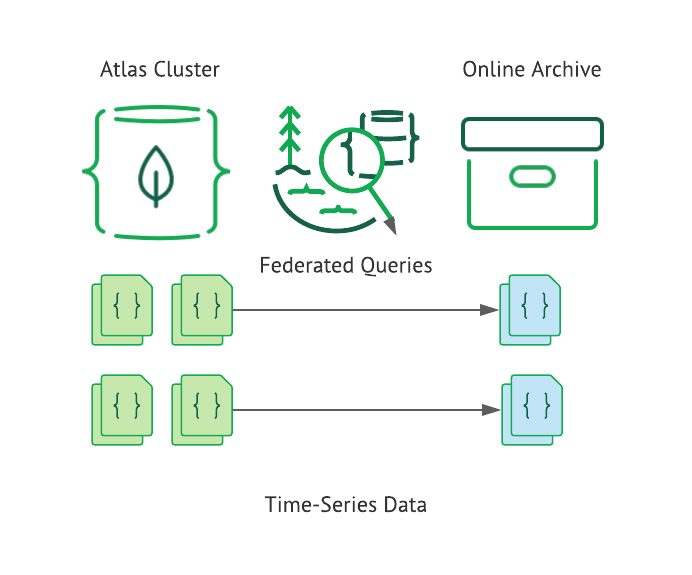
Another option for handling old data is to tier it into operational and online archive storage. You can use Atlas Online Archive to automatically archive data from your Atlas cluster.
Online Archive has many advantages:
Separating hot data retained in the operational Atlas cluster database and cold archived data maintained in the Online Archive storage
Optimizing costs while retaining a significantly large dataset for various purposes, e.g., compliance and history purposes
Maximum storage and query performance for archived time series data through MongoDB’s Atlas Online * Archive.
Federated queries allow developers to query both hot data in the Atlas cluster and cold data in the Online Archive together, seamlessly allowing you to couple historical data with new data.
MongoDB provides a variety of aggregation pipeline operators and aggregation pipeline stages to enable developers to analyze data. These operators and stages are available for all collections — time series or regular. Let's examine some of the new operators and a stage that were added in version 5.0 to make working with dates and times easier.
New Aggregation Pipeline Operators: $dateAdd, $dateDiff, and $dateTrunc
In version 5.0, MongoDB added these aggregation pipeline operators:
$dateAdd: Adds a specified amount of time to a Date object
$dateDiff: Returns the time difference between two dates
: Returns a date that has been truncated to the specified unit
These new operators make working with time series data even easier. Visit the official MongoDB documentation on aggregation pipeline operators to learn more about all of the available operators.
$dateTrunc Example
Consider the original stock data example:
For this example, the dowJonesTickerData collection is using “date” as a timeField and “symbol” as a metaField.
Let's say we want to calculate the average closing stock price per month for each stock in the collection. We can use the $dateTrunc to truncate the dates to the appropriate month. Then, we can use $group to first, group the documents by month and symbol and, second, calculate the average for each group.
The result of running the above aggregation is a set of documents. Each document contains the average closing price per month for a particular stock. Below are example documents that resulted from running the above aggregation.
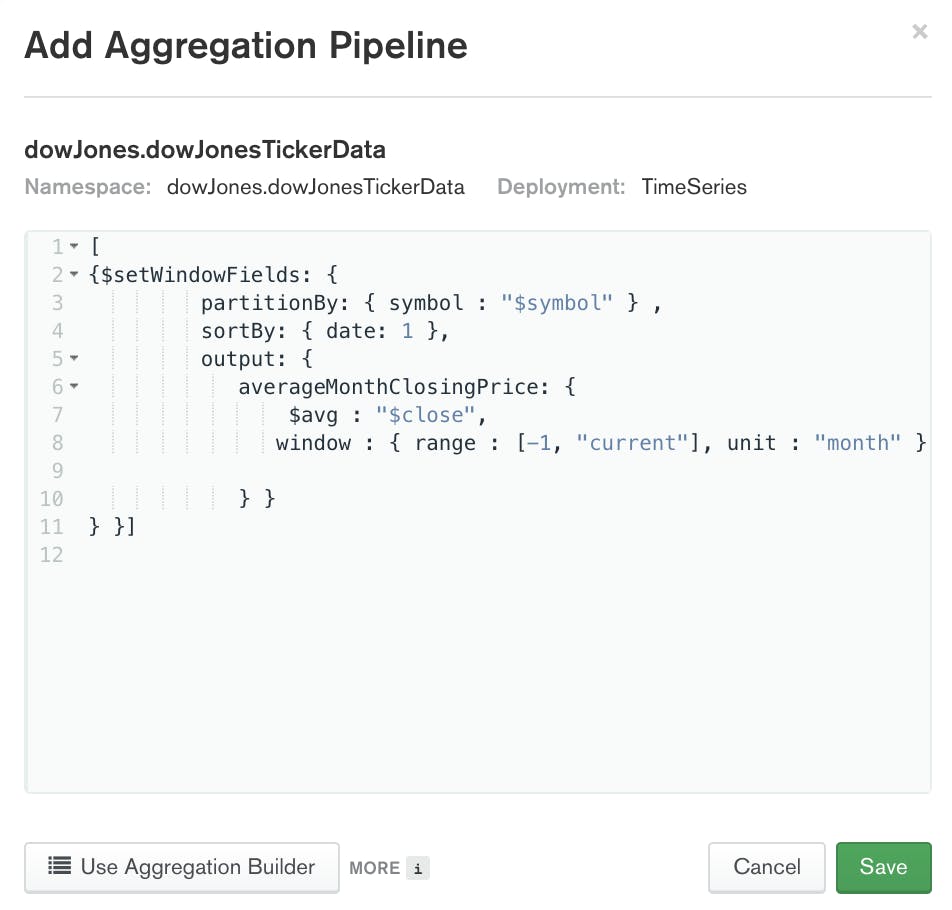
Window Functions with New Aggregation Pipeline Stage: $setWindowFields
Window functions allow developers to run calculations on documents in a given window. MongoDB added support for window functions in version 5.0 with the introduction of the $setWindowFields aggregation pipeline stage. Similar to $group, $setWindowFields allows you to apply one or more operations on a defined window. In $group, documents are grouped together and then calculations are performed on each group. In $setWindowFields, the windows are relative to each document, so the calculations are performed on each document.
With the new $setWindowFields operator, you can calculate a rolling average of the closing price over the last 30 days for each stock:
The result of running the above aggregation is a set of documents. The set will contain the same number of documents as the original collection. Each document in the results will contain a new field: $averageMonthClosingPrice. The value of $averageMonthClosingPrice is the average of the previous month's closing price for the indicated stock symbol. Below is an example document that resulted from running the above aggregation.
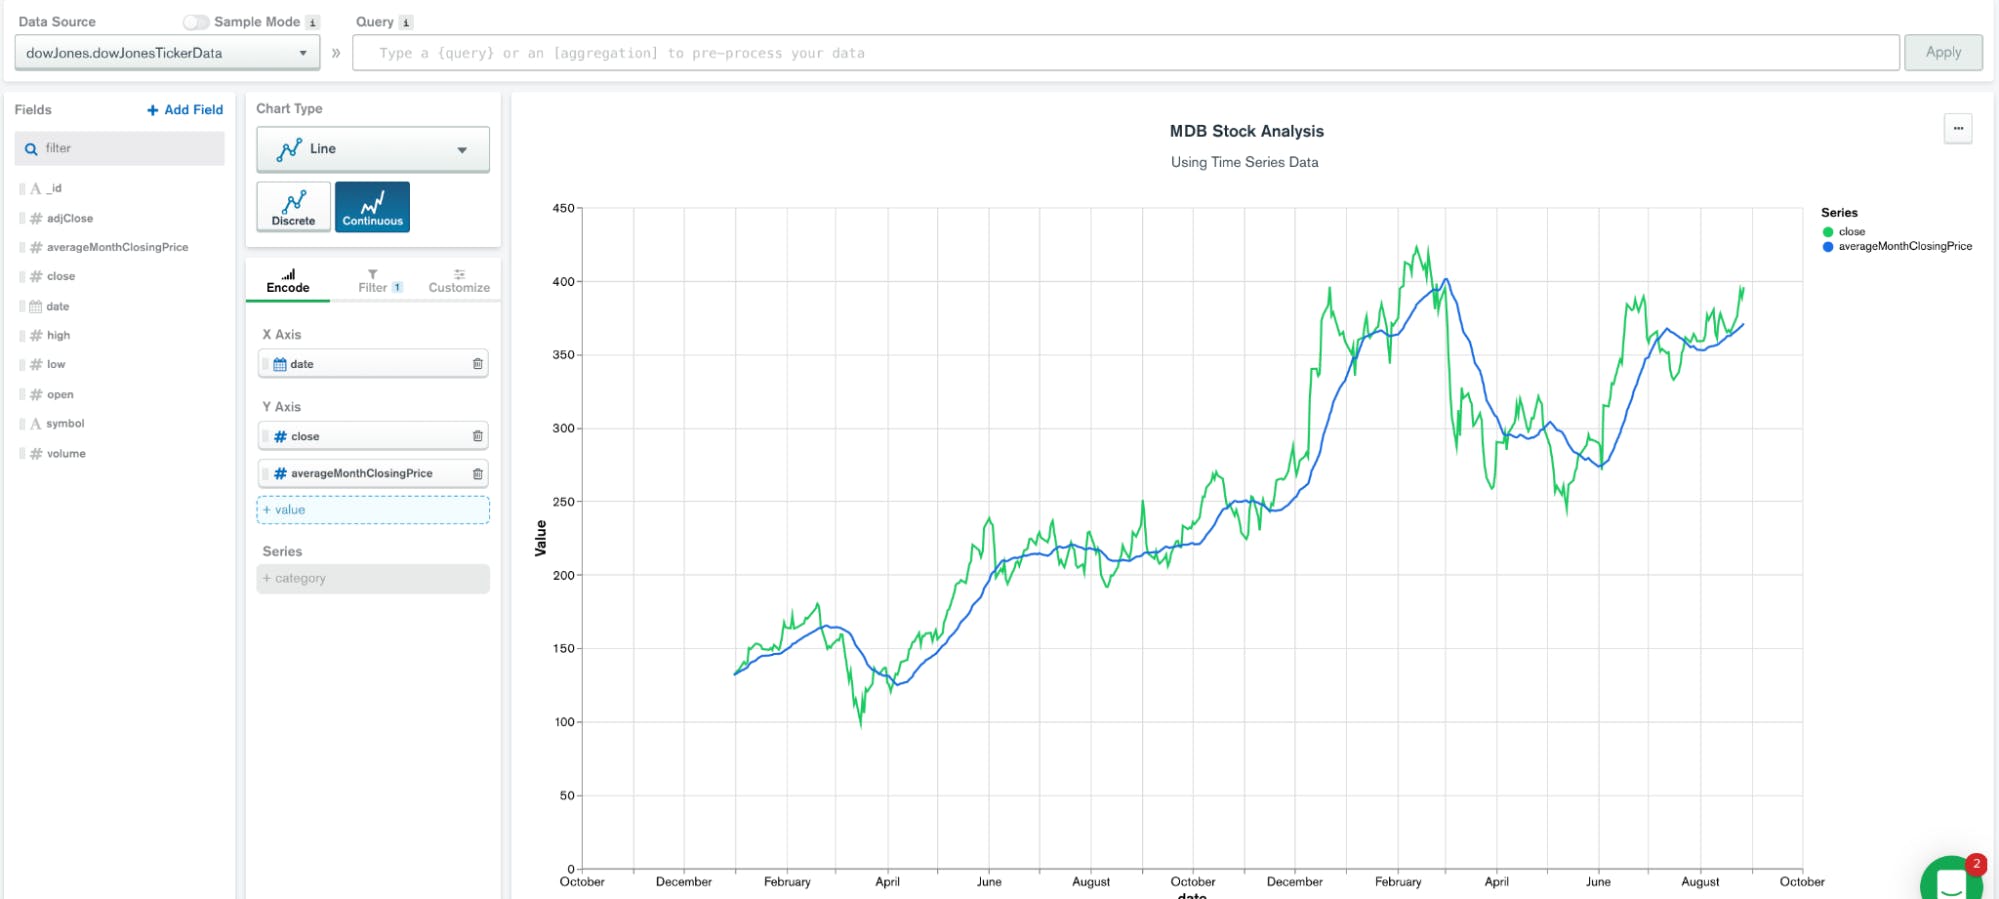
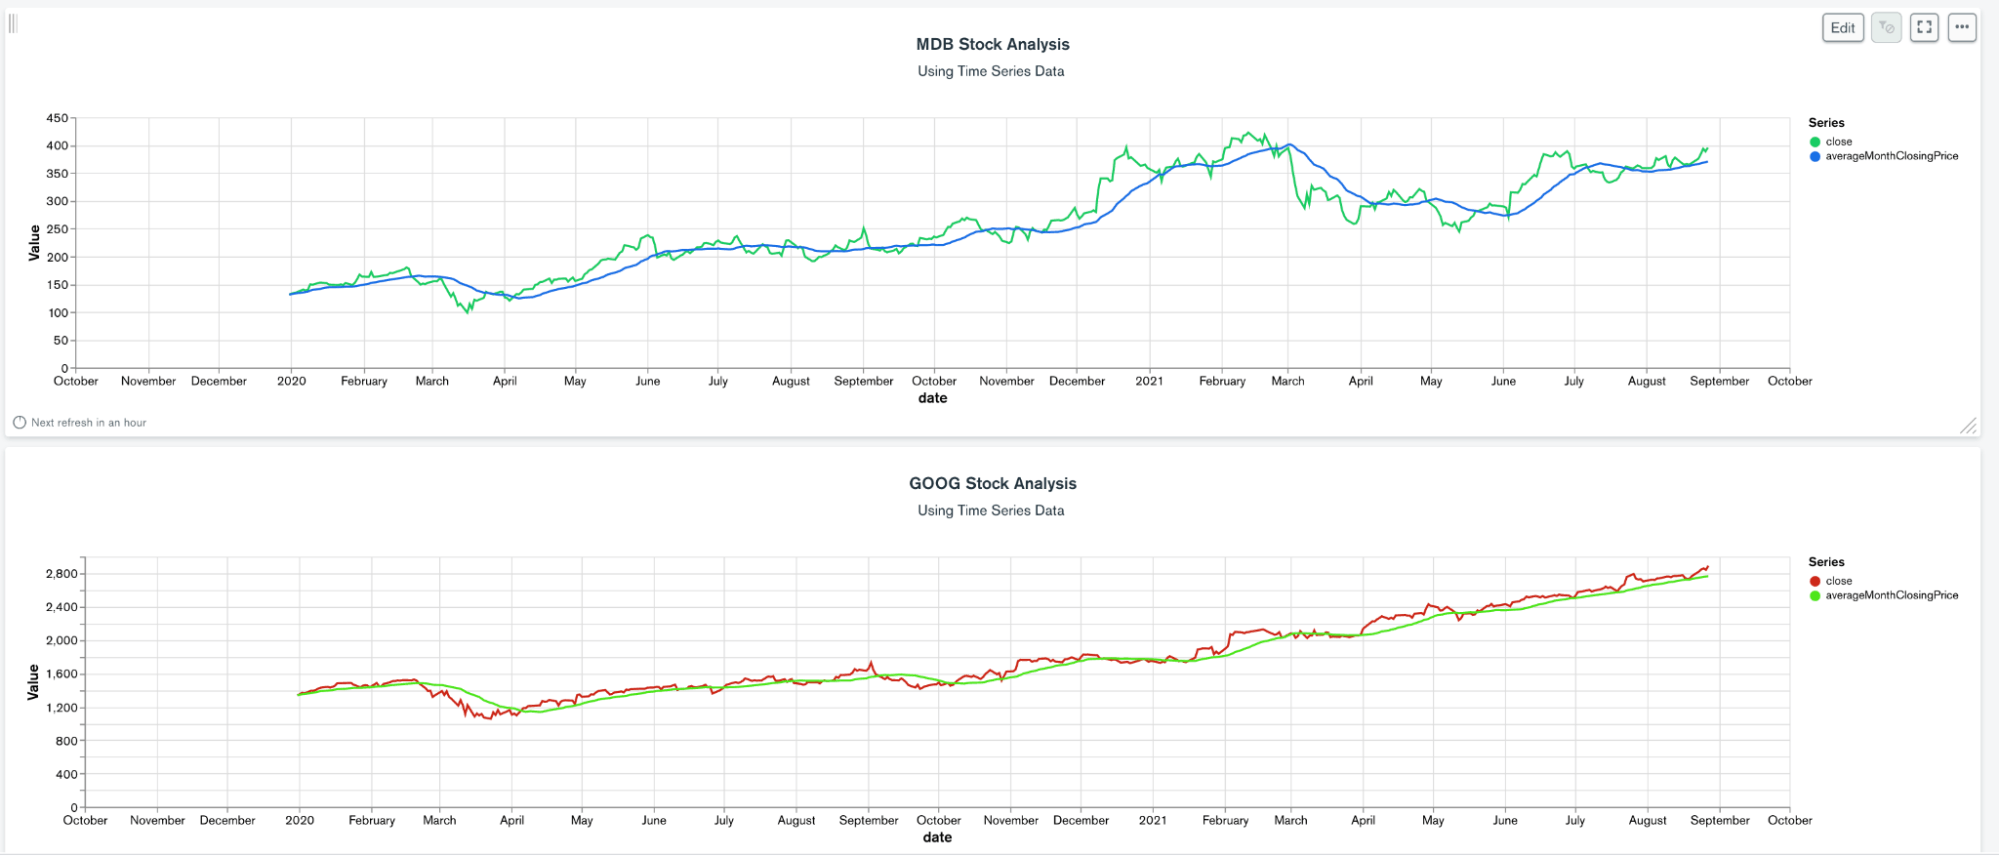
MongoDB Charts is a great tool to visualize the data calculated by the above aggregation pipeline.
Adjust the chart’s Data Source to use the same pipeline we did above:
As a result, the data source exposes all fields such as symbol, date, close, and averageMonthClosingPrice, which can be used directly in a line graph:
When charting this data, we can see the immediate value of this analysis:
The graphs above show a closing price and a rolling 30-day average graph of each stock.
Best Practices for Storing Time Series Data in MongoDB
Below is a list of six best practices for working with time series data in MongoDB:
Use time series collections with time series data when possible.
When using a time series collection, store individual measurements or groups of measurements as one document inserted in batches.
Tune your data to have appropriate metaField and timeField considering the data characteristics and query patterns.
Tune your data granularity according to your data ingestion rate as it relates to the cardinality of your metaField, or the unique combinations of your unique metaField. For example, if your metaField is customerId, but you only get data from a unique customerId every five minutes, you should change your granularity to minutes, despite potentially receiving 10ks insert per minute overall. Spikes in data for your metaField values are fine. This doesn’t need to be uniform, but should be an approximation as best as possible.
Time series data is everywhere, but storing and querying it can be challenging. MongoDB added native support for time series data in version 5.0, making it even easier, faster, and cheaper to work with time series data.
FAQs
Time series data are measurements taken at time intervals from one or more sources. When analyzed, the individual data pieces form a meaningful insight over a period of time. Examples are weather measurement data and stock trading data.
MongoDB is a general purpose document database that has native support for time series data. MongoDB's time series collections are optimized and purpose-built for ingesting, storing, and querying time series data. Therefore, users can use a single unified Query API utilizing MongoDB as a time series database alongside other database use cases.
MongoDB 5.0 has an optimized time series collection type which is designed to efficiently store and consume time series data. Prior to version 5.0, MongoDB had a suggested data model for time series data.
MongoDB time series collections are available in all 5.0+ versions of MongoDB including Community, Enterprise Advanced, and Atlas.
There are multiple ways to use time series data. For example, you can consume time series data to perform calculations using aggregation pipelines and plot graphs on the application side, via MongoDB Charts. This makes MongoDB and MongoDB Atlas a compelling store for large volumes of time series data.
Get started with Atlas today
Get started in seconds. Our free clusters come with 512 MB of storage so you can play around with sample data and get oriented with our platform.