>> Announcement: Some features mentioned below will be deprecated on Sep. 30, 2025. Learn more.
Manufacturing companies leverage business intelligence (BI) to sift through and analyze manufacturing and supply chain data in order to become more efficient and productive organizations. Often, the real hurdle with analytics is ensuring reliable access to relevant data sets. This article describes how to prepare data to yield strategic and operational insights through a combination of data tiering, federation, querying, and visualization.
Consider the scenario of a car manufacturer looking to implement a predictive maintenance program to reduce maintenance costs for its car assembly machines. Establishing an optimal data storage infrastructure is critical to allow them to find correlations between live IoT sensor data and historical maintenance records, thereby gaining insights into maintenance trends and correlating sensor data.
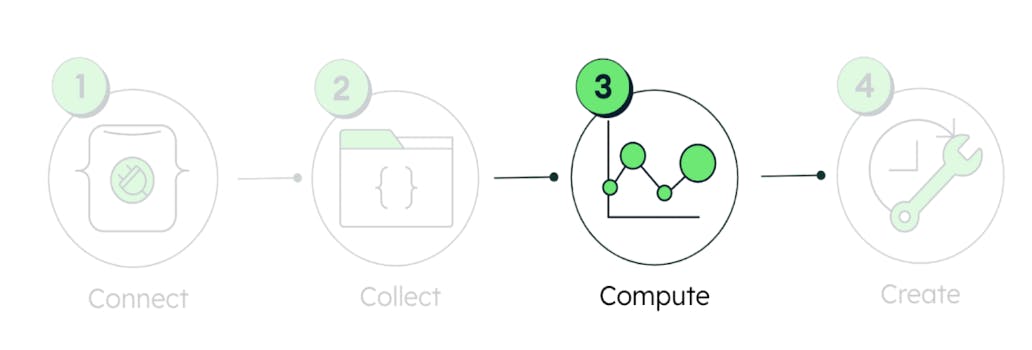
As shown in Figure 1, such a challenge falls under step 3 of our IIoT end-to-end data integration framework: Compute.
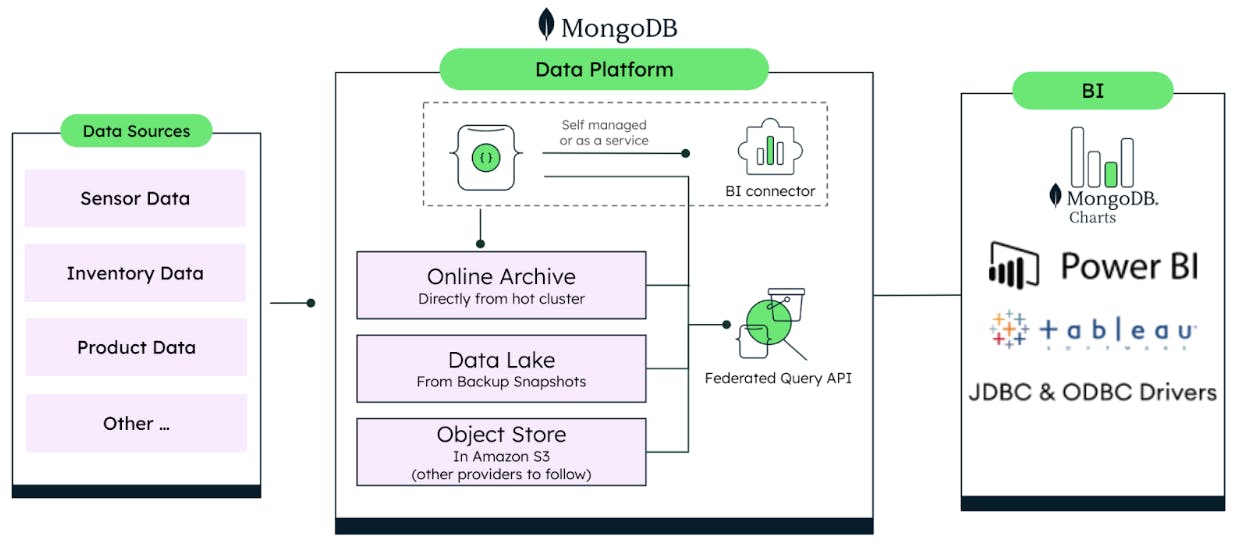
The proposed methodology leverages the different data tiering capabilities of MongoDB covering the full data lifecycle to create a single API access for BI/analytics. Figure 2 summarizes the different MongoDB features and third-party integrations available to take advantage of the volumes of data generated over time for data-driven business insights.
The challenge of data tiering
The car manufacturer in our example would most likely need to differentiate between the different types of data needed for its predictive maintenance model. Here we make a distinction between operational and analytical workloads.
Operational workload: Refers to latency-sensitive data that affects functioning of equipment or powers critical applications/processes.
Analytical workload: Refers to life and historical data that does not power mission-critical applications but is readily stored and queried for the purpose of reporting, analytics, or training of AI/ML models.
Figure 3 provides a basic illustration of how MongoDB handles workload isolation leveraging MongoDB replica sets to support real-time BI and analytical workloads without additional ETL jobs.
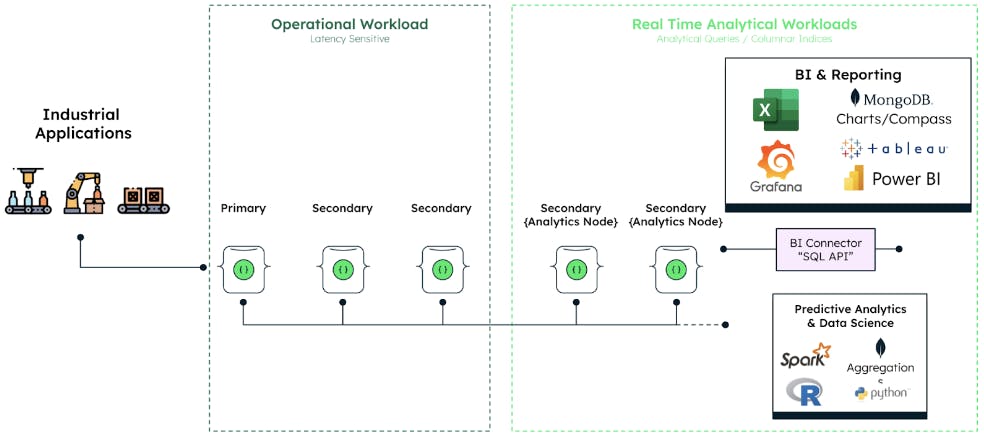
More advanced architecture patterns for workload isolation or data tiering can be achieved through sharding. Although these approaches are suitable for many scenarios, they are still more like hot/warm data because storage and compute are still tightly coupled.
For maximum cost efficiency at the expense of latency, we must consider newer cloud storage options, such as Amazon S3 or other Blob stores, which decouple storage and compute and are perfectly suited to store so-called cold data. The challenge, however, is how to extract the data from hot stores (such as MongoDB), bring it into the cold storage (such as S3) while maintaining the ability to query the data through a single API.
MongoDB provides several options to facilitate fully automated data tiering, including:
Online Archive: Rule-based data archiving
Online Archive in MongoDB Atlas provides an automated rule-based mechanism for moving data out of live/hot clusters to more cost-effective/cold storage (for example, Amazon S3 buckets). This feature removes the burden of building and maintaining potentially complex ETL jobs and data purging functionality while allowing users to configure data offloading within a few simple configuration steps.
Online Archive moves data based on criteria specified in archival rules (as shown in Figure 4). In our example of an auto manufacturing company, sensor data is an excellent use case for this type of data tiering. Sensor data is “hot” when it's created and cools down over time with less need for real-time queries. Our car manufacturer can easily configure an archival rule dependent on the timestamp and in combination with the number of days they want to keep the data in the MongoDB cluster.
A broad set of MongoDB Atlas customers across industries already uses Online Archive to save storage costs while maintaining query ability across hot and cold data.
Although offloading data already provides major cost savings, there is also potential for more efficient data processing on the consumer side by optimizing the data structures and file formats toward more column-oriented analytical queries. For this purpose, MongoDB has recently released a Data Lake feature set (currently in Preview) that allows users to take advantage of new features such as columnar indexing and an optimized analytical file format.
Data Lake: Columnar indexing of database snapshots
Data Lake is MongoDB’s offering of a fully managed analytical storage solution that provides the economics of cloud object storage and is optimized for high-performing analytical queries. It works by reformatting data from a backup snapshot of the Atlas cluster and creating partitioned indexes (illustrated in Figure 5).
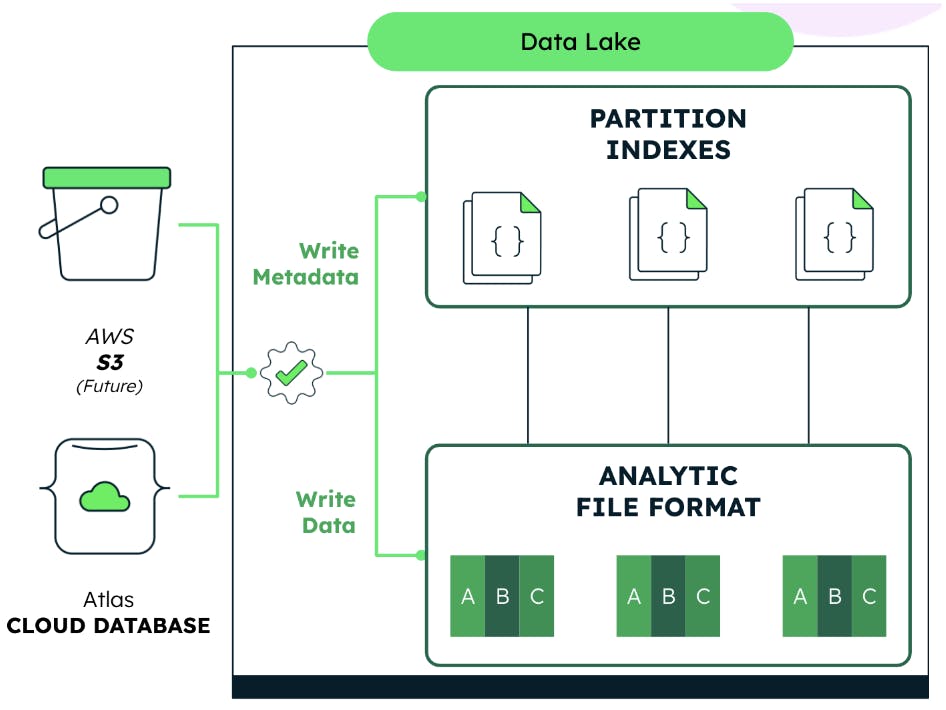
Fully integrated as part of MongoDB Atlas, Atlas Data Lake is provisioned alongside Atlas clusters with no infrastructure to set up or manage, and no storage capacity to predict, making the user experience, administration, and support easy. Returning to our example of predictive maintenance model development, performing columnar indexing on the collected data will result in high gains for analytical query performance.
Data Federation: Data virtualization made simple
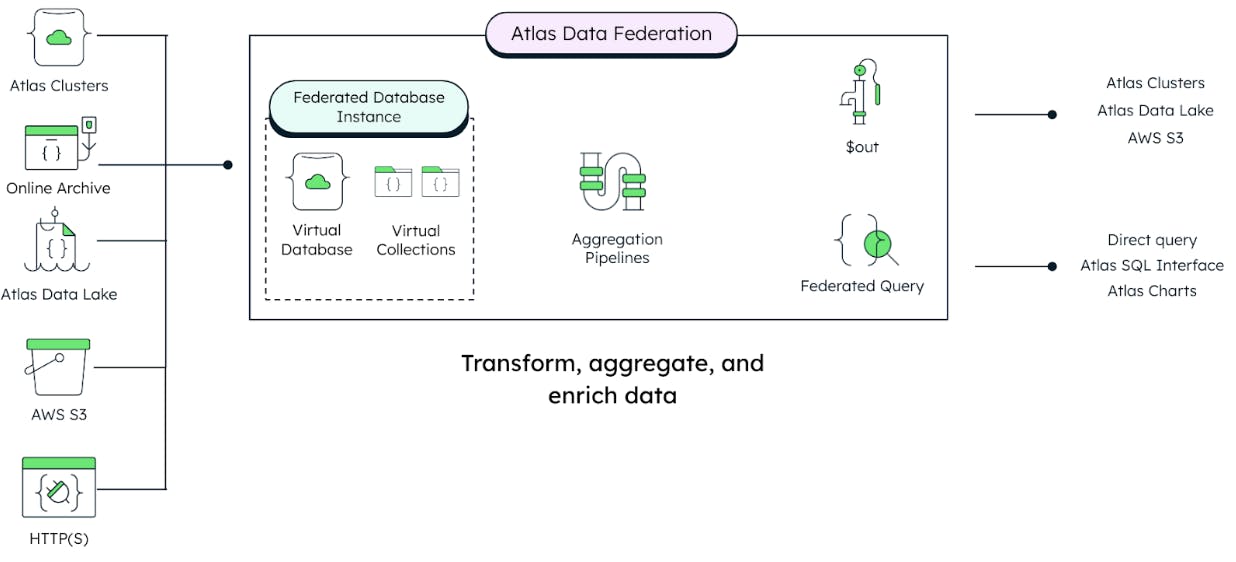
Rarely do business analysts have all the required data in the same place. Often, it’s distributed among different domains and data stores as well as in different formats, like JSON, tabular, CSV, Parquet, Avro, and others. This leads to quite a complex landscape with different API languages, which makes it hard to get easy access to data across all these sources. That's where MongoDB's Atlas Data Federation comes in.
Data Federation allows bridging of these data silos by consolidating all the discussed data sources behind a single API without the need for data duplication (Figure 6). Users can group different data sources to virtual databases and collections and query the data with MQL or SQL across the various sources just like talking to a single DBMS. This approach reduces the effort, time-sink, and complexity of pipelines and ETL tools when working with data in different formats. It also allows users to seamlessly query, transform, and aggregate data from one or more data stores (i.e., Atlas cluster, Atlas Data Lake, Amazon S3 buckets, Online Archive, and HTTP endpoints) to create a single virtual database using the full power of the aggregation pipeline (Figure 7).
.gif)
Please refer to the documentation for a more detailed description of the process of creating a Federated Database Instance in MongoDB Atlas.
Data Federation endpoints are not just read-only APIs. Results of querying a federated database instance can be stored back in MongoDB clusters or as files in S3 buckets to power other real-time enterprise or end-user applications, or for performing other analytical tasks and visualizations. In the case of our car manufacturer, real-time sensor data and maintenance history can be queried together and made available to an analytical engine training ML models for remaining useful life prediction.
The fastest way to start building compelling visualizations and gaining insight into the data across MongoDB clusters and file-based data sources through federated instances is through the use of Charts, which comes fully integrated in the Atlas product suite.
Data visualization with Charts
Charts provides a quick, simple, and yet powerful way to visualize data with multiple widgets, dynamic filters, and automatic data refresh like you know it from traditional BI tools. Atlas users can connect dashboards created in Atlas Charts with federated databases and perform correlation analytics in a no-code environment.
Charts is fully integrated with the MongoDB Atlas product suite, which means that data sources in Atlas are immediately accessible from the interface, allowing users to add federated databases as a source for a variety of dashboard visualizations. From displaying device sensor data to calculated values for more sophisticated insights, Charts provides widgets and custom fields calculations to achieve effective and insightful visualizations.
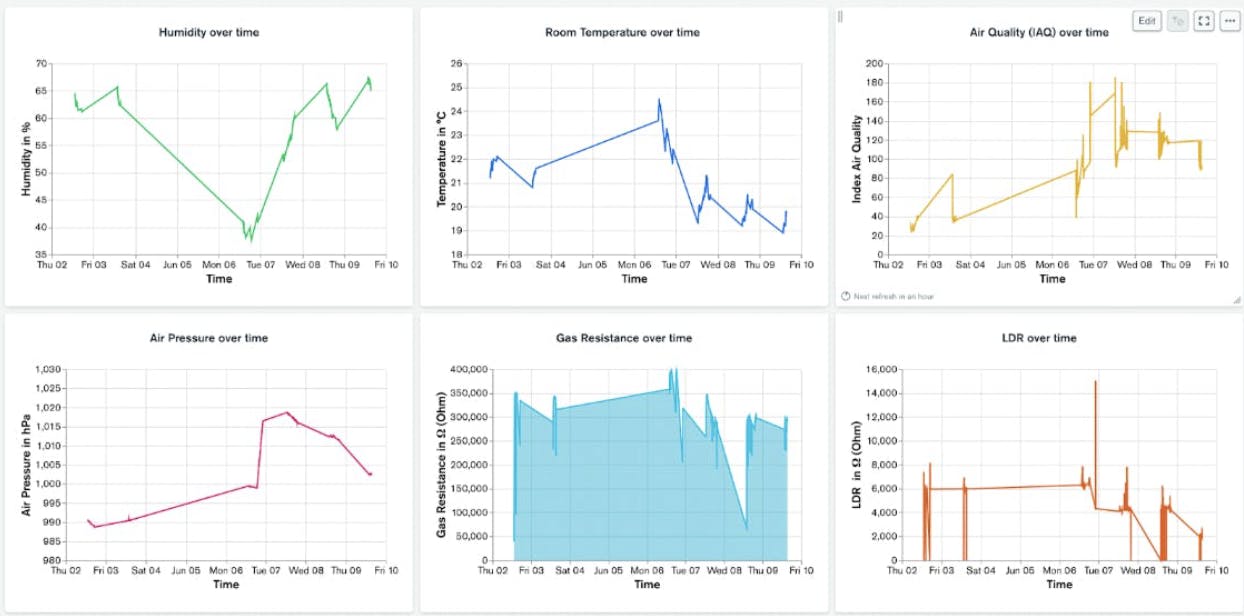
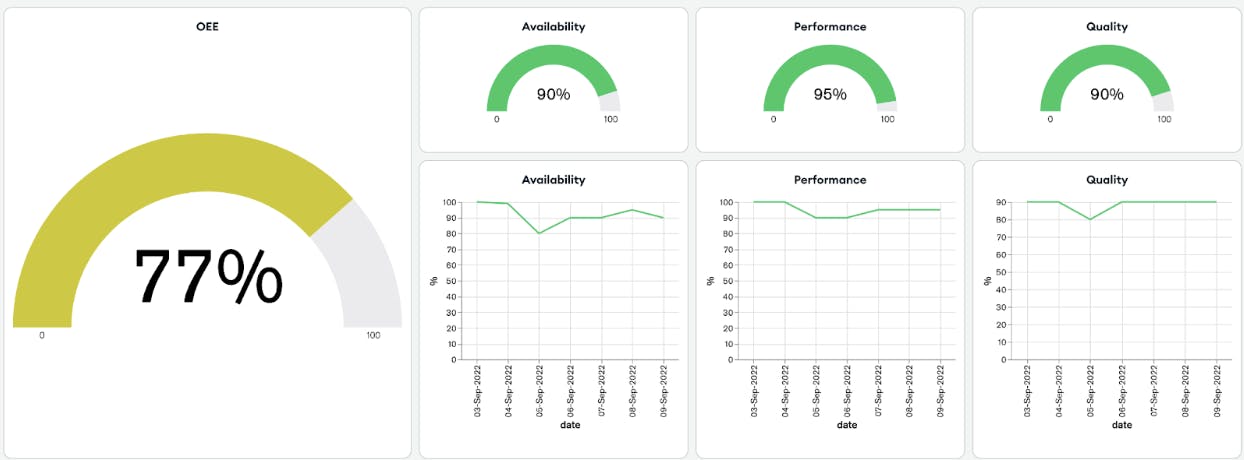
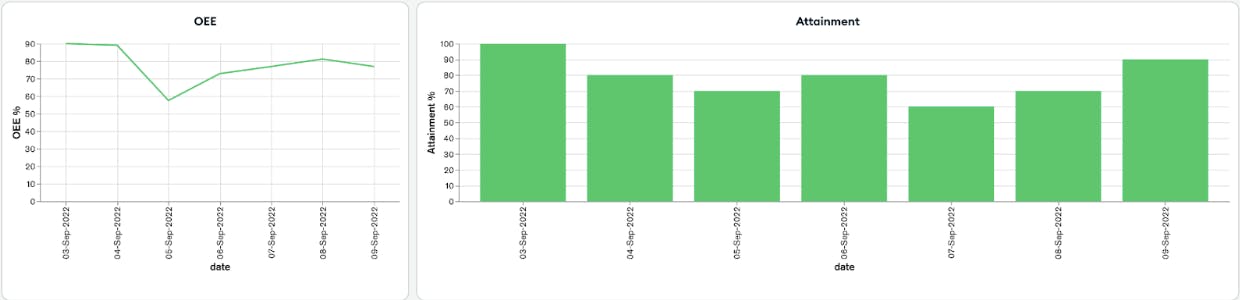
Figures 8 and 9 show two examples of dashboards created in Charts showing time series sensor data from a smart factory and Overall Equipment Effectiveness (OEE) along with other manufacturing performance metrics information. Through the use of these powerful visualizations, the car manufacturer can understand the effect of optimal maintenance strategies on overall factory performance.
To harness existing knowledge and skills around familiar and popular BI tools such as Power BI and Tableau, MongoDB has developed Atlas SQL API, which gives users the option to connect SQL-based business intelligence and analytics tools to Atlas through a variety of drivers and connectors including:
Tableau Connector
Power BI Connector
JDBC Driver
ODBC Driver
These Atlas SQL connectors and drivers leverage Data Federation functionality, thereby enabling users to query data across Atlas clusters and cloud storage (such as S3 buckets) and to maintain the comfort of existing SQL-based BI tools that they are familiar with.
Getting started is easy using the Atlas SQL API at no cost with the detailed tutorial and the documentation. Register for a free Atlas user account to try it out.
Thank you to Karolina Ruiz Rogelj for her contributions to this post.
Watch our recorded webinar to see a live demonstration of how Atlas Federated Instances are created and used as a data source for MongoDB Charts and Tableau.