The Industrial Internet of Things (IIoT) is driving a new era of manufacturing, unlocking powerful new use cases to forge new revenue streams, create holistic business insights, and provide agility based on global and consumer demands.
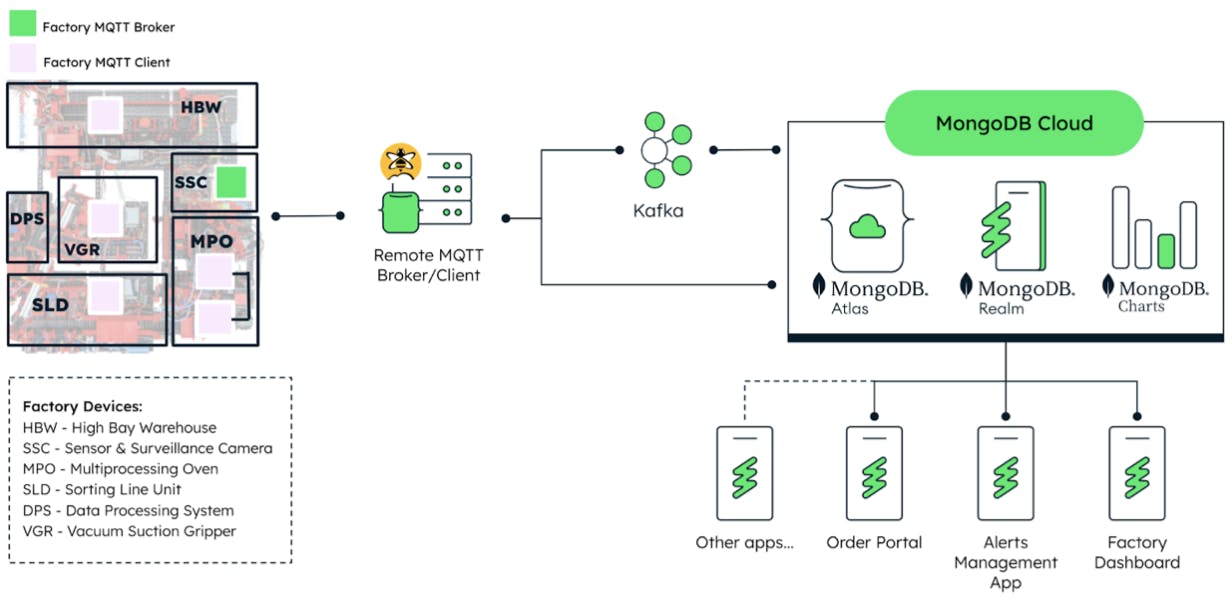
In Part 1 of this series, “Manufacturing at Scale: MongoDB & IIoT,” we gave an overview of the adoption and implementation of IIoT in manufacturing processes, testing various use cases with a model-size smart factory (Figure 1). In this post, we’ll look at how MongoDB’s flexible, highly available, and scalable data platform allows for end-to-end data integration using a four-step framework.
4-step framework for end-to-end data integration
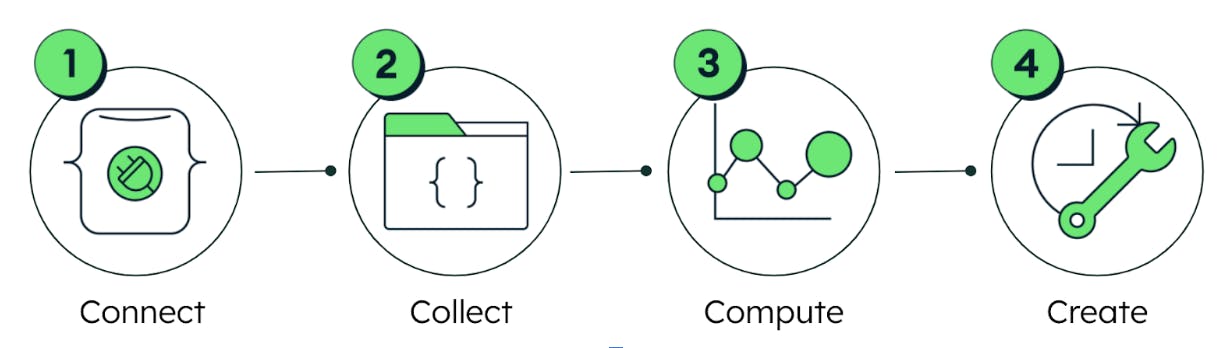
The four stages of this framework (Figure 2) are:
Connect: Establish an interface to “listen” and “talk” to the device(s).
Collect: Gather and store data from devices in an efficient and reliable manner.
Compute: Process and analyze data generated by IoT devices.
Create: Create unique solutions (or applications) through access to transformational data.
During the course of this series, we will explore each of the four steps in detail, covering the tools and methodology and providing a walkthrough of our implementation process, using the Fischertechnik model as a basis for testing and development. All of the steps, however, are applicable to any environment that uses a Message Queuing Telemetry Transport (MQTT) API. The first step of the process is Connect.
The first step: Connect
The model factory contains a variety of sensors that are generating data on everything from the camera angle to the air quality and temperature — all in real time. The factory uses the MQTT protocol to send and receive input, output, and status messages related to the different factory components.
You may wonder why we don’t immediately jump to the data collection stage. The reason is simple; we must first be able to “see” all of the data coming from the factory, which will allow us to select the metrics we are interested in capturing and configure our database appropriately.
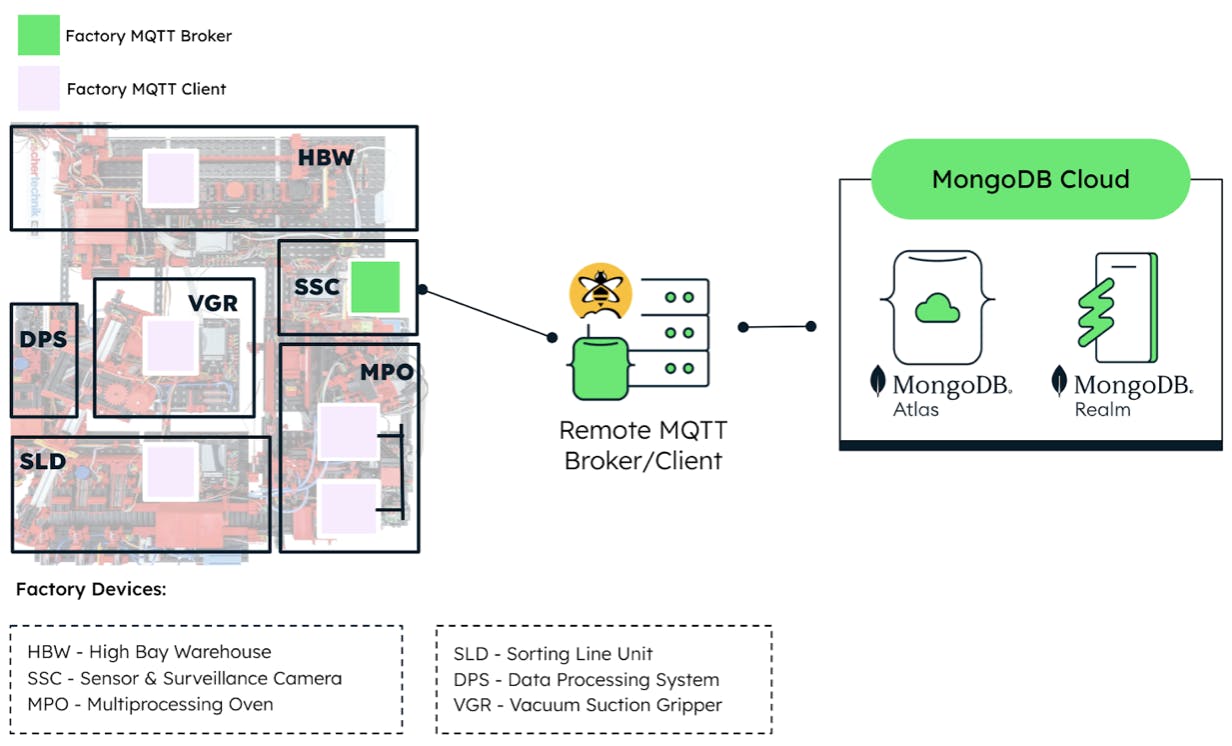
As a quick refresher on the architecture diagram of the factory, we see in Figure 3 that any messages transmitted in or out of the factory are routed through the Remote MQTT Broker. The challenge is to successfully read and write messages to and from the factory, respectively.
It is important to remember that the method of making this connection between the devices and MongoDB depends on the communication protocols the device is equipped with. On the shop floor, multiple protocols are used for device communication, such as MQTT and OPC-UA, which may require different connector technologies, such as Kafka, among other off-the-shelf IoT connectors.
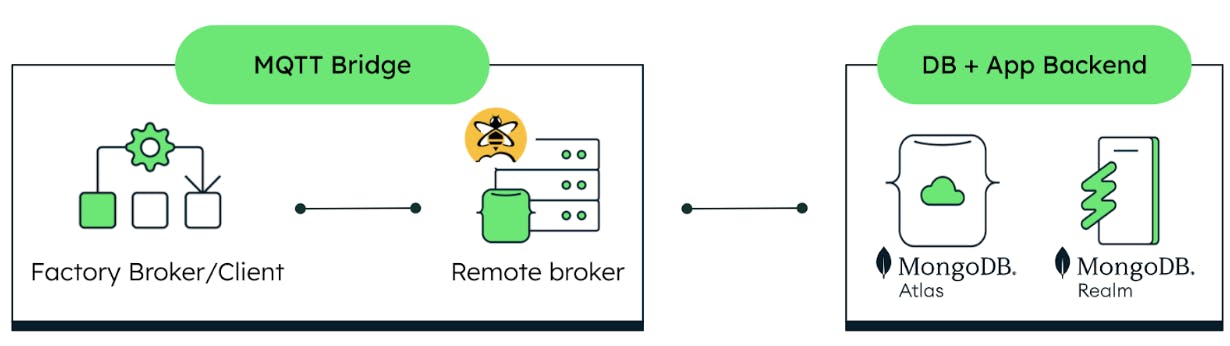
In most scenarios, MongoDB can be integrated easily, regardless of the communication protocol, by adding the appropriate connector configuration. (We will discuss more about that implementation in our next blog post.) For this specific scenario, we will focus on MQTT. Figure 4 shows a simplified version of our connection diagram.
Because the available communication protocol for the factory is MQTT, we will do the following:
Set up a remote MQTT broker and test its connectivity.
Create an MQTT bridge.
Send MQTT messages to the device(s).
Note that these steps can be applied to any devices, machinery, or environment that come equipped with MQTT, so you can adapt this methodology to your specific project. Let’s get started.
1. Set up a remote MQTT broker
To focus on the connection of the brokers, we used a managed service from HiveMQ to create a broker and the necessary hosting environment. However, this setup would work just as well with any self-managed MQTT broker.
HiveMQ Cloud has a free tier, which is a great option for practice and for testing the desired configuration. You can create an account to set up a free cluster and add users to it. These users will function as clients of the remote broker. We recommend using different users for different purposes.
Test the remote broker connectivity
We used the Mosquitto CLI client to directly access the broker(s) from the command line. Then, we connected to the same network used by the factory, opened a terminal window, and started a listener on the local TXT broker using this command:
Next, in a new terminal window, we published a message to the remote broker on the same topic as the listener. A complete list of all topics configured on the factory can be found in the Fischertechnik documentation. You can fill in the command below with the information of your remote broker.
If the bridge has been configured correctly, you will see the message “Hello” displayed on the first terminal window that contains your local broker listener.
Now we get to the good part. We want to see all the messages that the factory is generating for all of the topics. Because we are a bit more familiar with the Mosquitto CLI, we started a listener on the local TXT broker using this command:
Where the topic “#” essentially means “everything.” And just like that, we can get a sense of which parameters we can hope to extract from the factory into our database. As an added bonus, the data is already in JSON. This will simplify the process of streaming the data into MongoDB Atlas once we reach the data collection stage, because MongoDB runs on the document model, which is also JSON-based.
The following screen recording shows the data stream that results from starting a listener on all topics to which the devices publish while running. You will notice giant blocks of data, which are the encoding of the factory camera images taken every second, as well as other metrics, such as stock item positions in the warehouse and temperature sensor data, all of which is sent at regular time intervals. This is a prime example of time series data, which we will describe how to store and process in a future article.

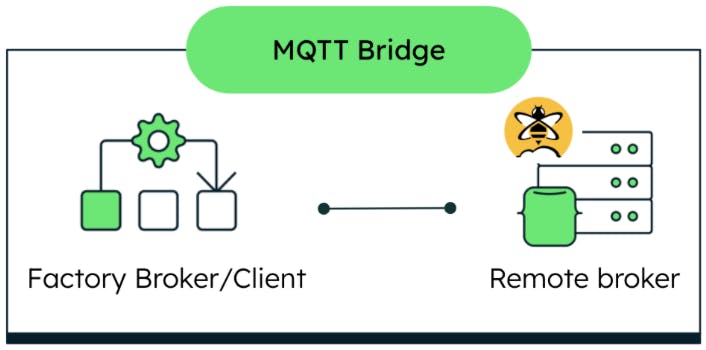
2. Create a MQTT bridge
An MQTT bridge (Figure 5) is a uni/bi-directional binding of topics between two MQTT brokers, such that messages published to one broker are relayed seamlessly to clients subscribed to that same topic on the other broker.
In our case, the MQTT broker on the main controller is configured to forward/receive messages to/from the remote MQTT broker via the following MQTT bridge configuration:
This configuration file is created and loaded directly into the factory broker via SSH.
3. Send MQTT messages to the device(s)
We can test our bridge configuration by sending a meaningful MQTT message to the factory through the HiveMQ websocket client (Figure 6). We signed into the console with one of the users (clients) previously created and sent an order message to the “f/o/order” topic used in the previous step.
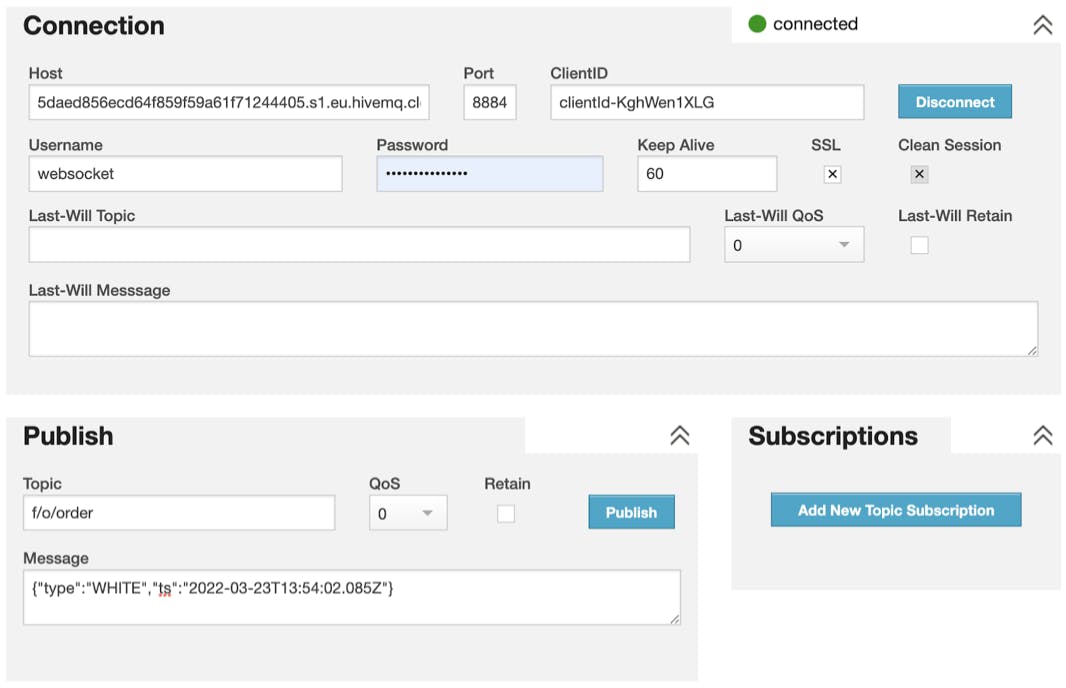
The format for the order message is:
“Type” refers to the color of the workpiece to order. We have a choice of three workpiece colors: RED, WHITE, BLUE; “ts” refers to the timestamp of when the message is published. This determines its place in the message queue and when the order process will actually be started. Once the bridge is configured correctly, the factory will start to process the order according to the workpiece color specified in the message. Thanks for sticking with us through to the end of this process. We hope this methodology provides fresh insight for your IoT projects.