Hi team, we are using MongoDB server version 5.0.10.
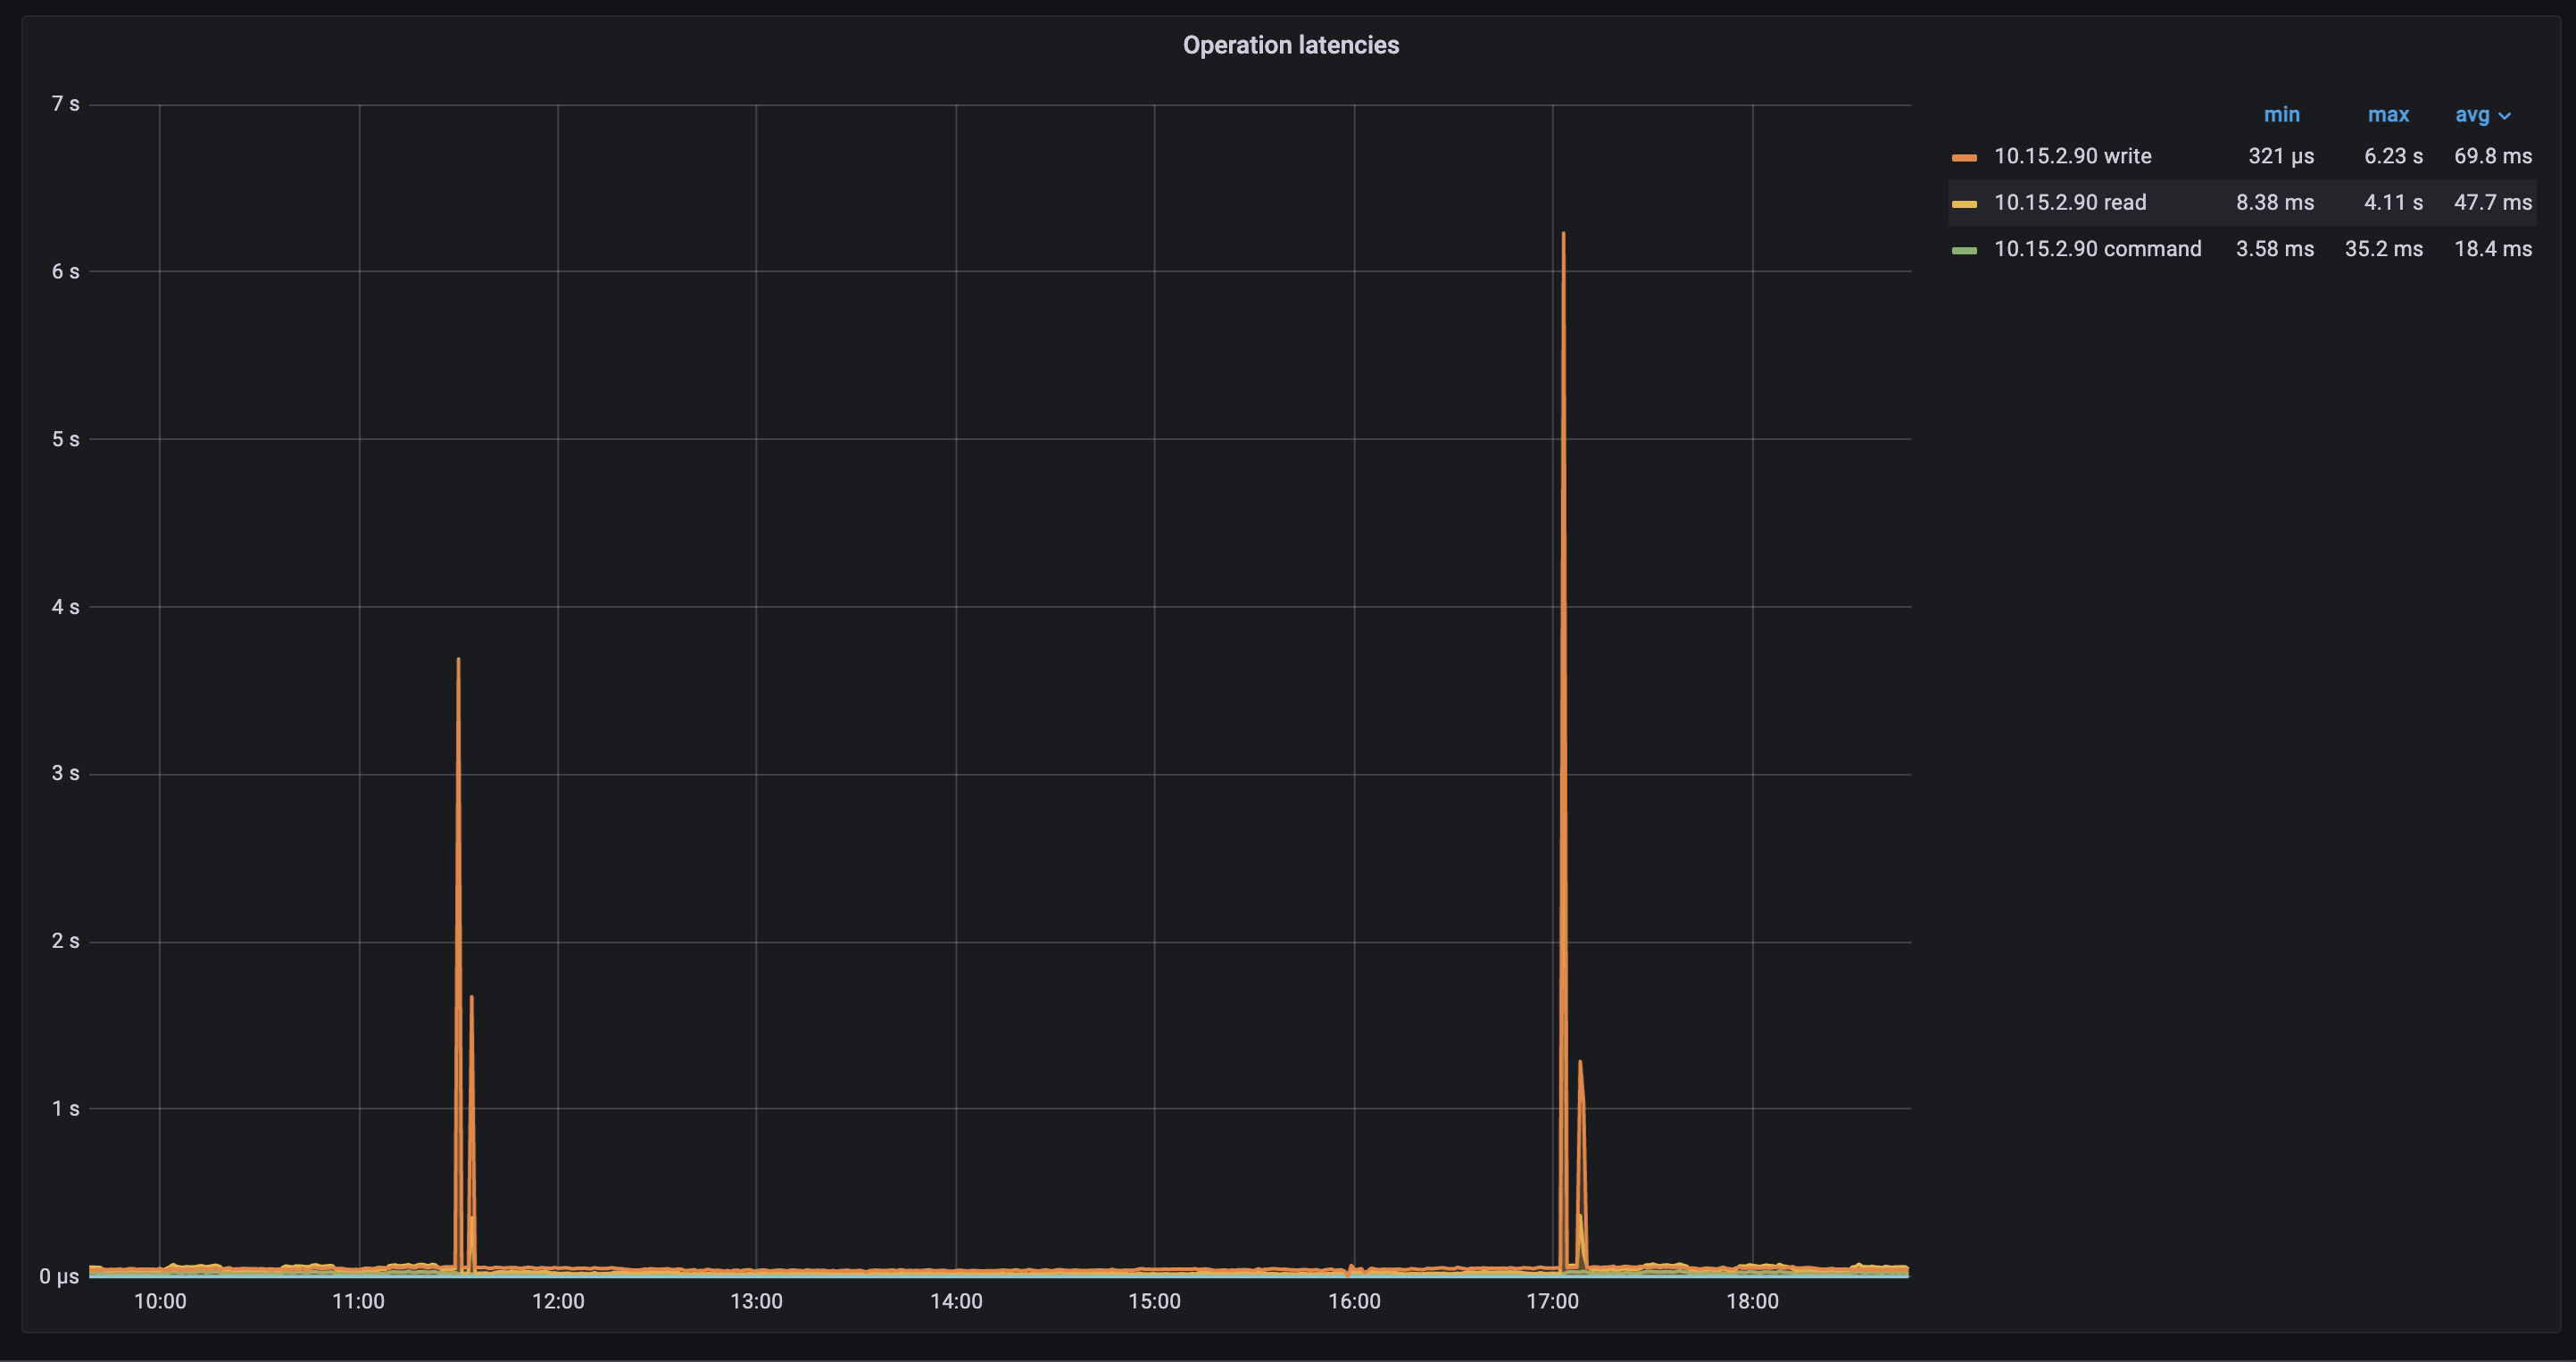
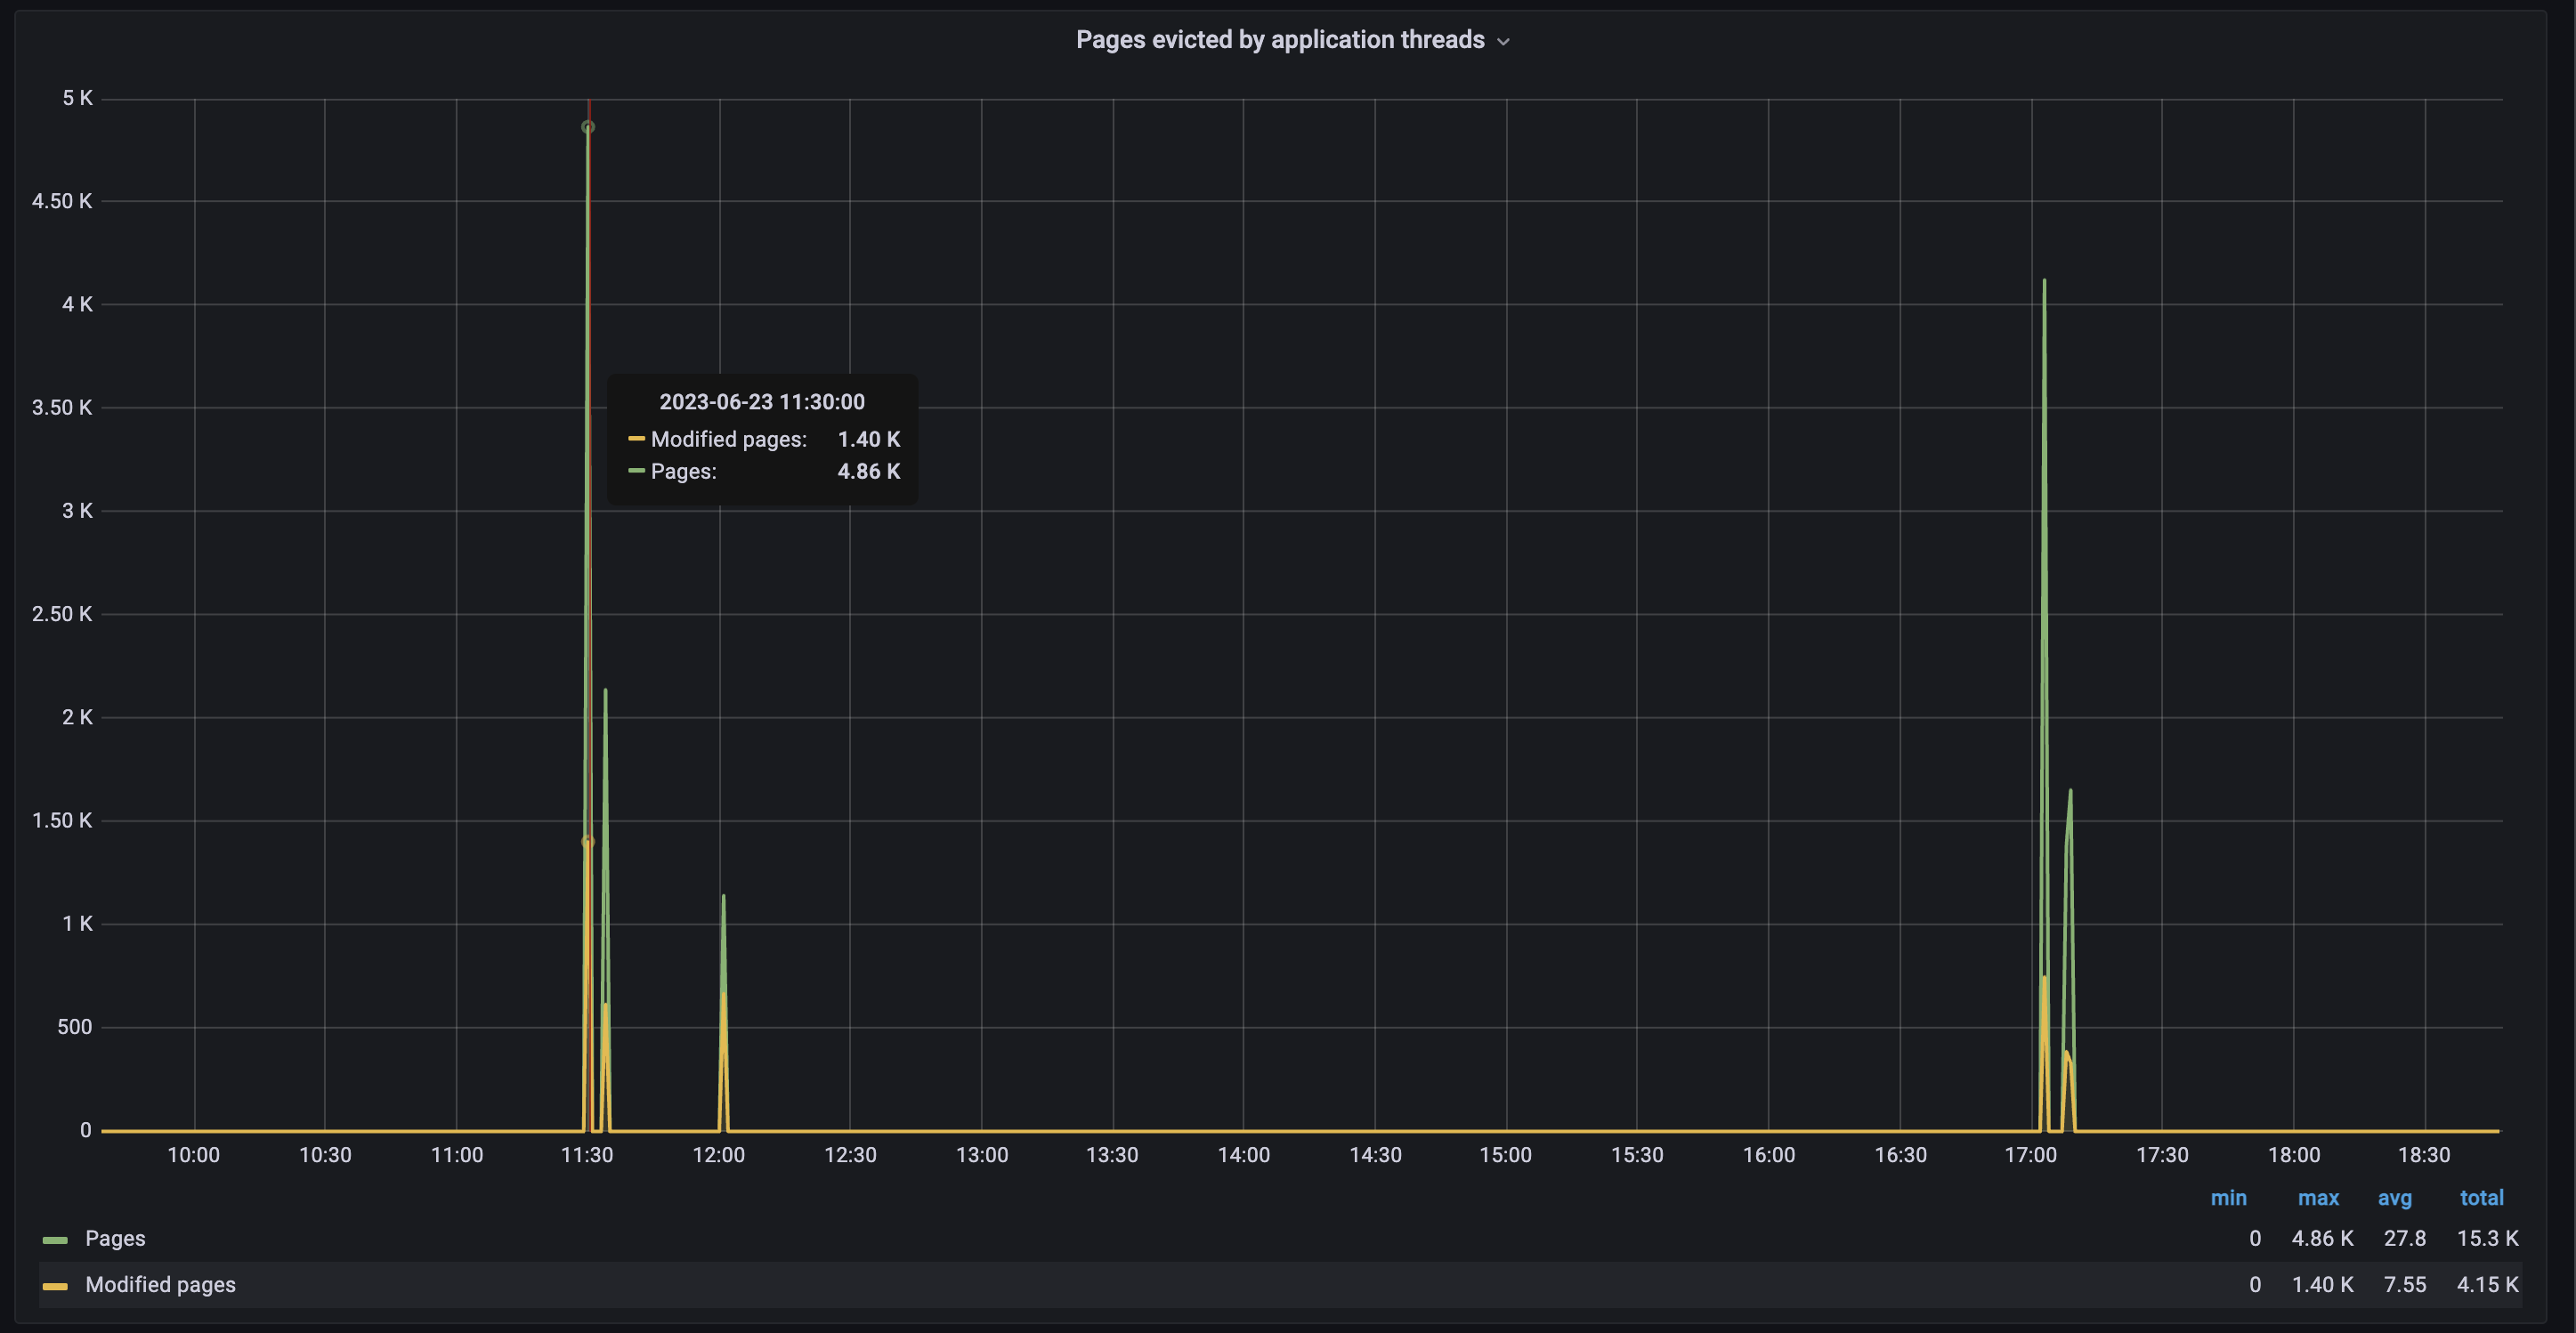
In the past few weeks, we have seen a spike in Page evicted by application threads, and coincidentally at the same time a spike in Operational Latencies (Writes and Reads).
The number of pages evicted during the operational latency spikes - 10k.
When going through the cache eviction documentation of WiredTiger, we came across the trigger values when application threads are supposed to be used in page eviction process.
When cache size hits 95%
When the dirty pages reach 20%
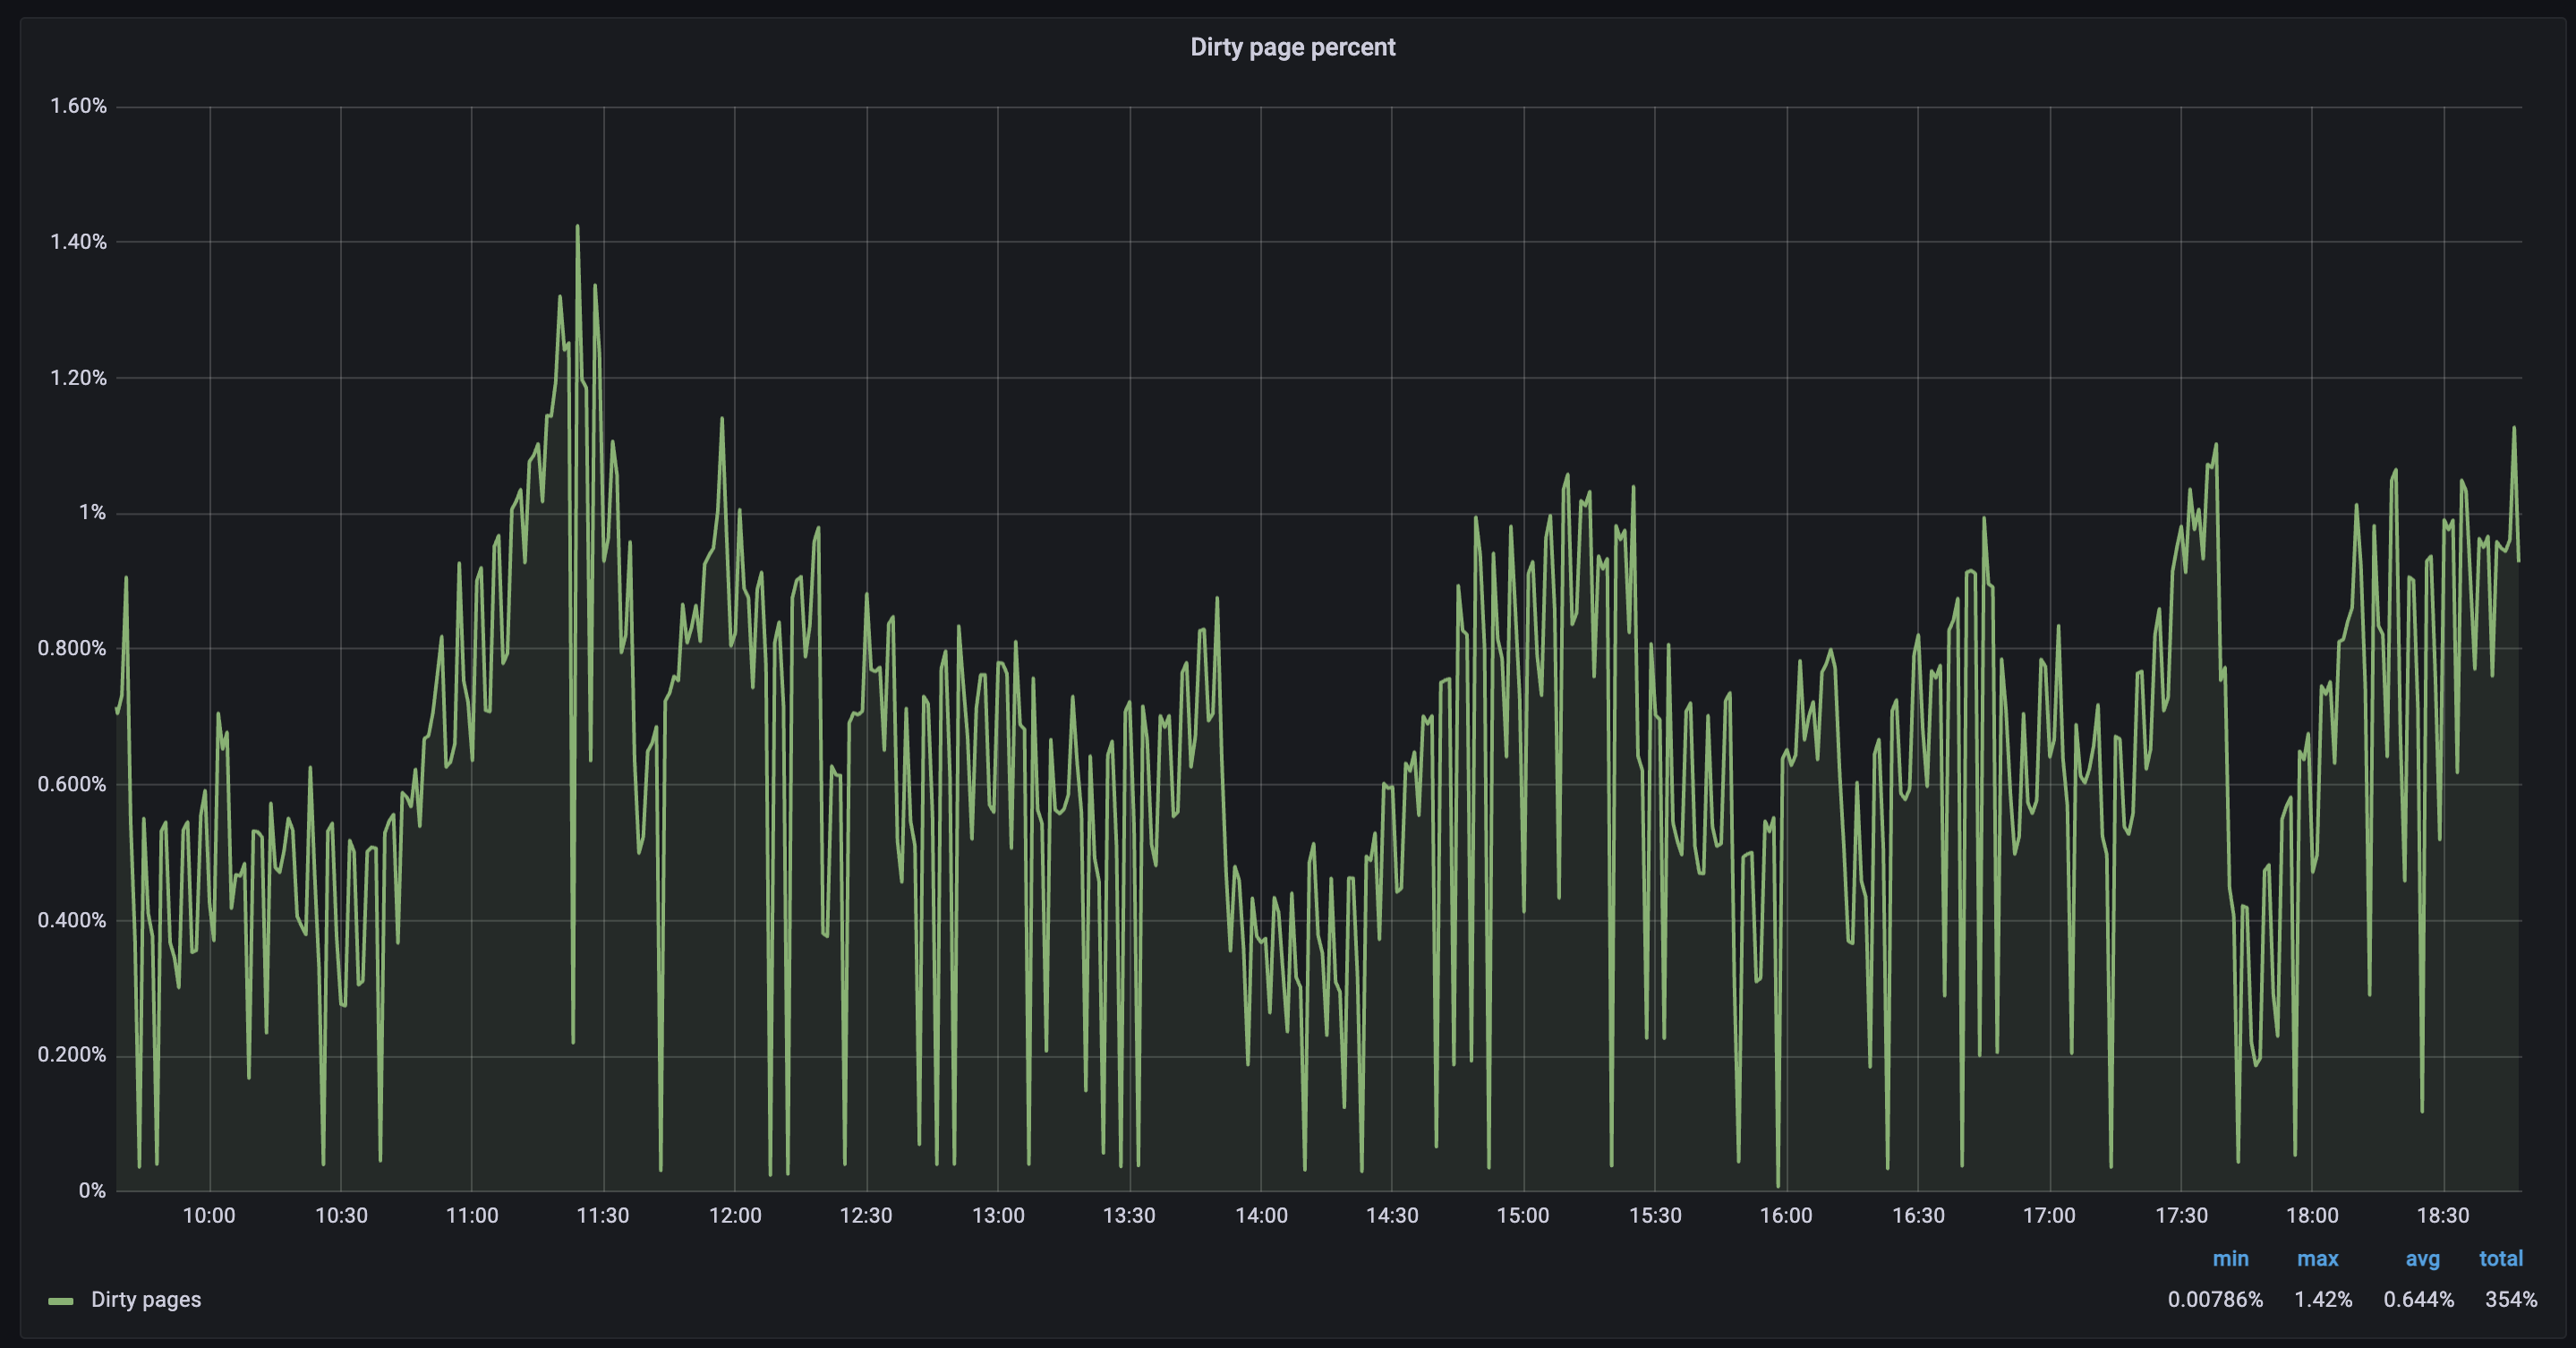
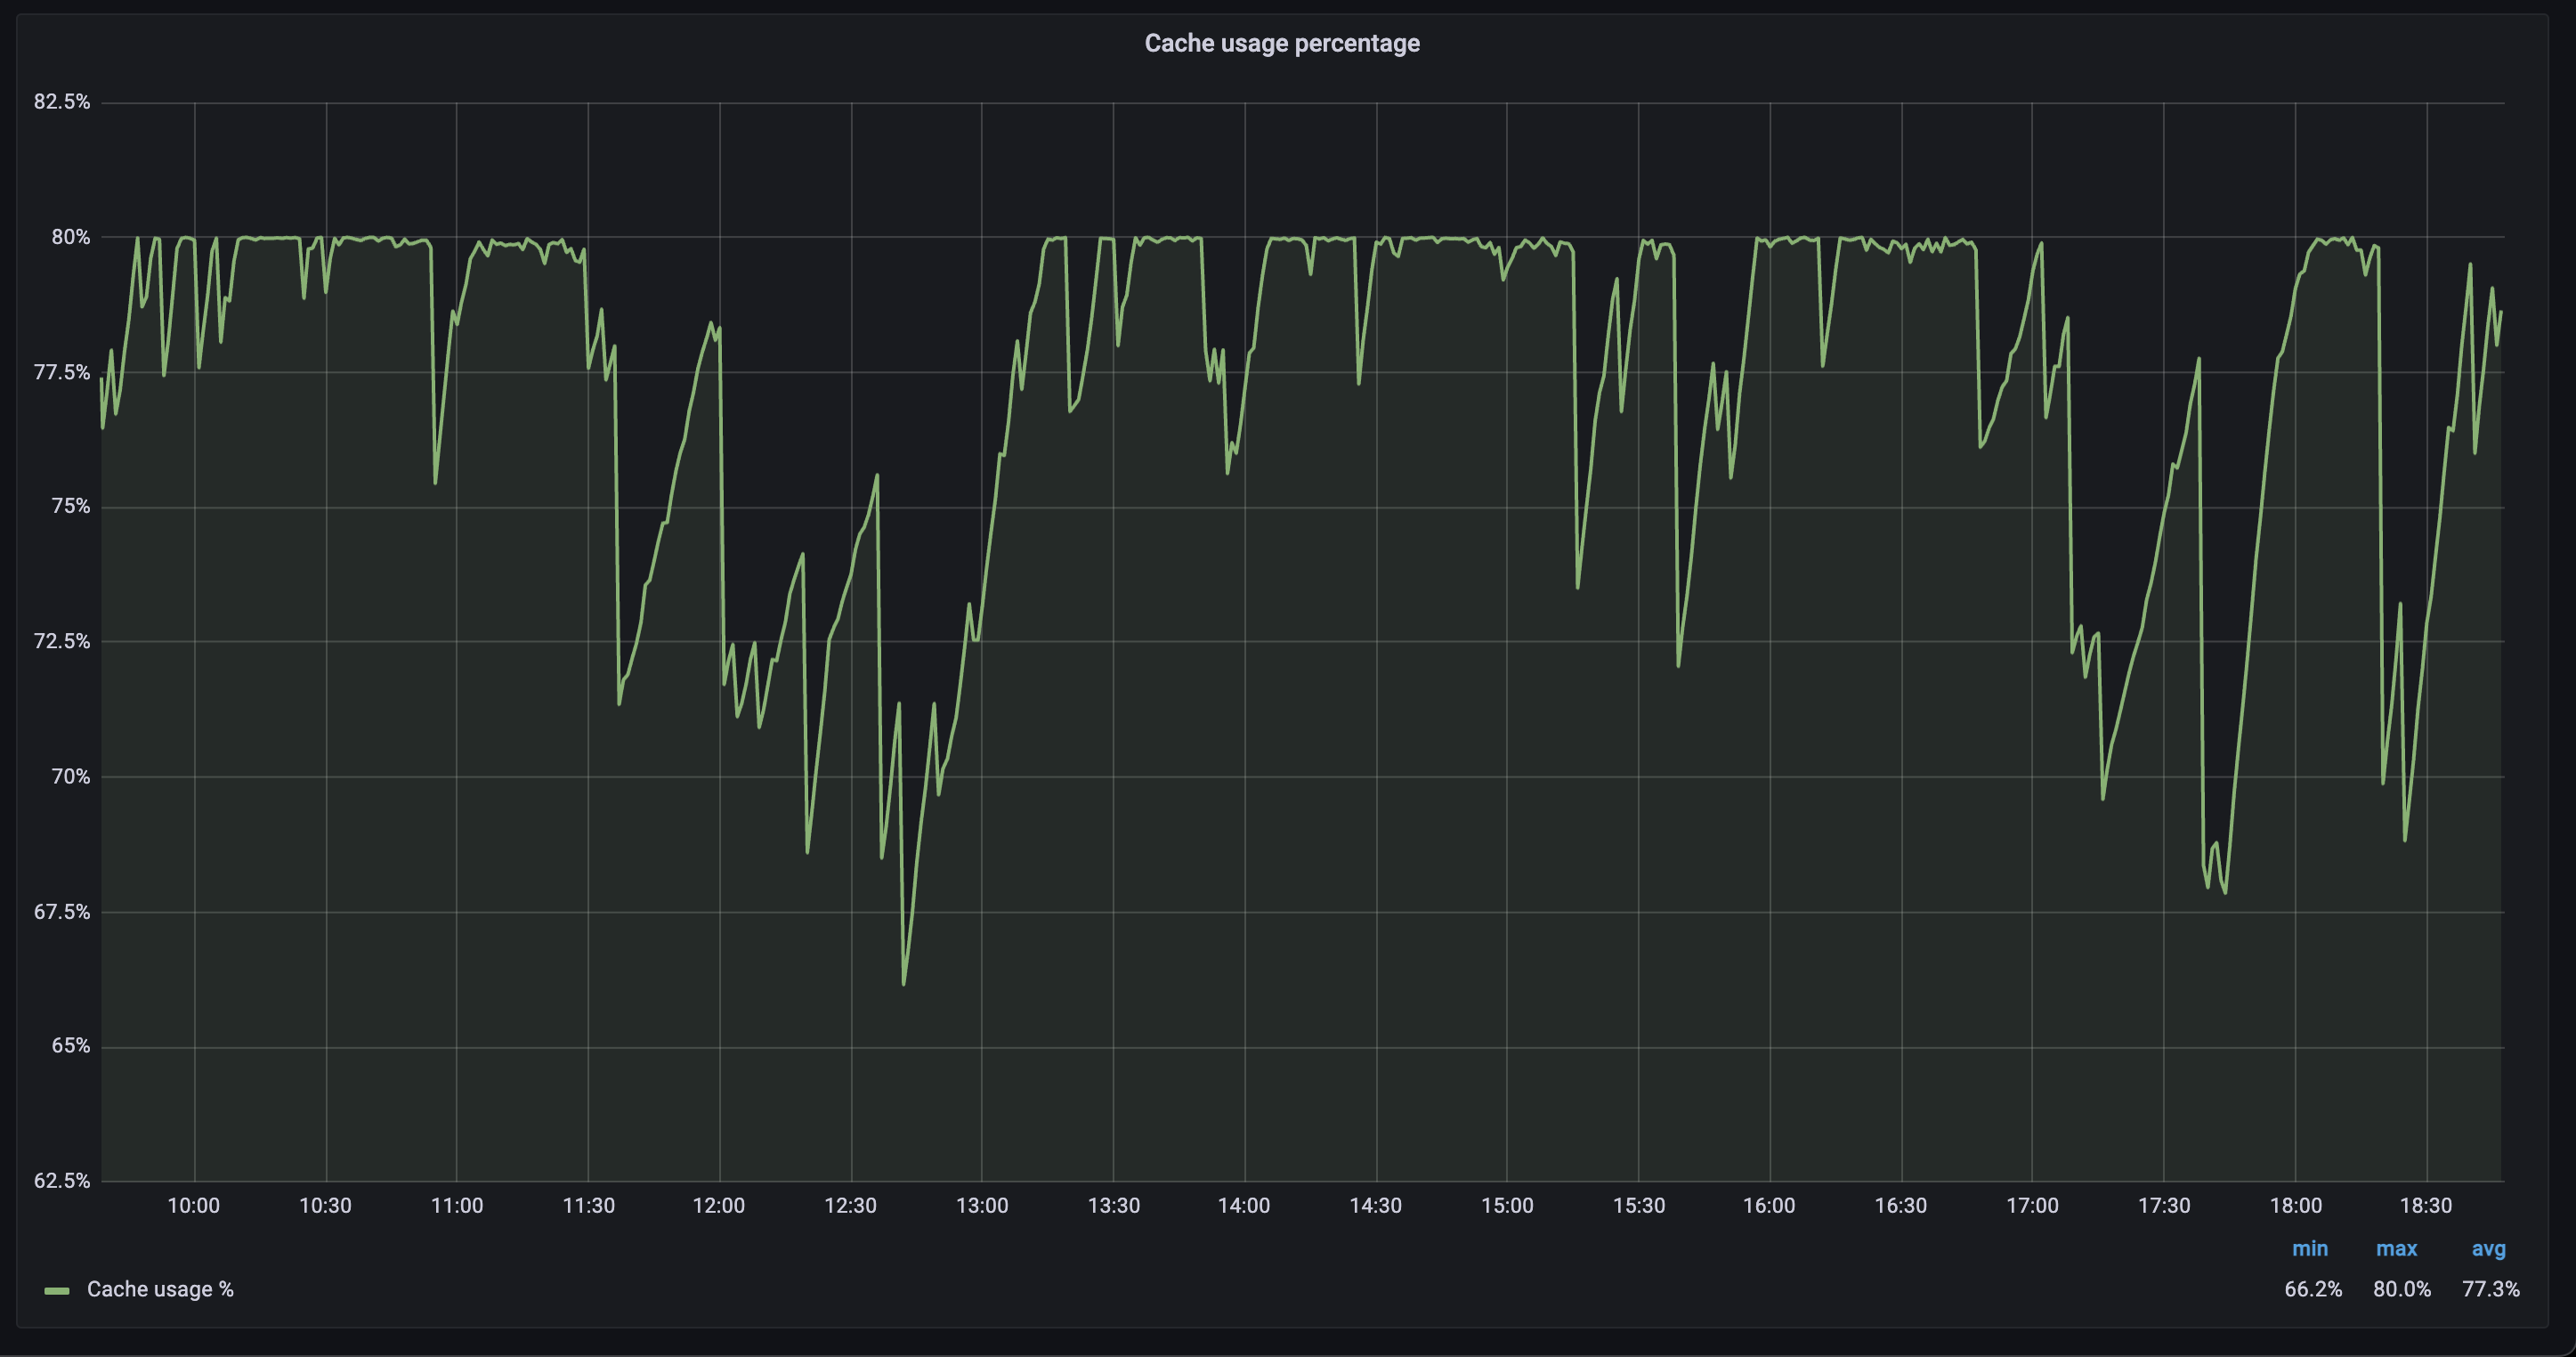
The attached figures below are the cache sizes and dirty pages at the instance when application threads are being used:
Cache percentage - 80%
Dirty Page percentage - 1.4%
The values are clearly under the threshold, is there any other reason why the application threads were used? How can we tune the mongoDB to fix this issue?
Please note : current cache eviction threads being used are the default set by MongoDB (4).
Hi @Uddeshya_Singh and welcome to MongoDB community forums!!
As mentioned in the Cache and eviction tuning, the eviction would begin when the threshold values are reached.
The cache serves as a valuable intermediary between application operations and disk I/O. WiredTiger, the system in question, strives to maintain cache usage at a maximum of 80%. Pushing the cache to its limit of 95% could introduce latency issues within the application.
However, in your case, since you are seeing evection at 80% of the cache utilisation might be a result of other operations which are utilising the cache.
There might be more than one reason when you seeing the increase and latency in your application.
A background process which might be performing some computations.
A concurrent process which is utilising the application thread.
A sudden increase in the workload.
I would recommend taking a look at the application with the above mentioned scenarios.
If, however, you are unable to resolve, you can reach out to MongoDB Support Hub for more detailed troubleshooting and observations.