100daysofcode - Day 53
Hello friends the 3rd day in our second half is already here, and as everyday the counter  is increasing and with each increment a lot of new informations get ready to be shared with our amazing community.

In today post we will talk about the agile effort  estimation techniques, by diving
  in each of them and exploring it’s work process.
There are all kinds of techniques to use when estimating effort in an Agile way. Effective relative effort estimation leads to successful and predictable sprint outcomes, which leads to a successful project overall. Generally speaking, the main steps to Agile estimation are the same, even if the specific approach varies. Some examples of Agile estimation techniques are:
- Planning Poker
- Dot Voting
- The Bucket System
- Large/Uncertain/Small
- Ordering Method
❶ Planning Poker 
-
This particular method is well-known and commonly used when Scrum teams have to make effort estimates for a small number of items (under 10). Planning Poker is consensus-based, meaning that everyone has to agree on the number chosen. In this technique, each individual has a deck of cards with numbers from the Fibonacci sequence on them. The Fibonacci sequence is where a number is the sum of the last two numbers (e.g., 0, 1, 2, 3, 5, 8, 13, and so on).
-
Sometimes, Planning Poker decks also include cards with coffee cups and question marks on them. The question mark card means that the person doesn’t understand what is being discussed or doesn’t have enough information to draw a conclusion. The coffee cup card means that the person needs a break.
-
The Planning Poker strategy is used in Sprint Planning meetings. As each Product Backlog item/user story is discussed, each team member lays a card face down on the table. Then, everyone turns their card over at the same time and the team discusses the estimates, particularly when they are far apart from one another. By first hiding the estimates, the group avoids any bias that is presented when numbers are said aloud. Sometimes, when hearing numbers aloud, people react to that estimate or the estimator themselves, and it changes what their initial thought may have been. In Planning Poker, teams can easily avoid that bias.
❷ Dot Voting 


- Dot Voting, like Planning Poker, is also good for sprints with a low
 number of Sprint Backlog items. In Dot Voting, each team member starts with small dot stickers, color-coded by the estimated effort required (e.g., S=green, M=blue, L=orange, XL=red). The items or user stories are written out on pieces of paper placed around a table or put up on the wall. Then, team members walk around the table and add their colored stickers to the items.
❸ The Bucket System 
-
The Bucket System is helpful for backlogs with many items since it can be done very quickly. In fact, a couple hundred items can be estimated in just one hour with the Bucket System. The Bucket System is an effective strategy for sizing items because it explores each item in terms of pre-determined “buckets” of complexity. Keep in mind that these buckets are metaphorical; this strategy doesn’t require the use of actual buckets, and instead uses sticky notes or note cards as buckets.
-
In this technique, the team starts by setting up a line of note cards down the center of the table, each marked with a number representing a level of effort. Then, the team writes each item or user story on a card. Each person draws and reads a random item, then places it somewhere along the line of numbered note cards. There is no need to discuss further with the team. If a person draws an item that they do not understand, then they can offer it to someone else to place. Additionally, if a person finds an item that they think does not fit where it was placed, they can discuss it with the team until a consensus about a more accurate placement is reached. Team members should spend no more than 120 seconds on each item.
❹ Large/Uncertain/Small 

- Large/Uncertain/Small is another quick method of rough estimation. It is great for product backlogs that have several similar or comparable items.
This is the same general idea as the Bucket System, but instead of several buckets, you only use three categories: large, uncertain, and small. Starting with the simpler, more obvious user stories, the team places the items in one of the categories. Then, the team discusses and places more complex items until each is assigned to a category.
❺ Ordering Method 
- The Ordering Method is ideal for projects with a smaller team and a large number of Product Backlog items. First, a scale is prepared and items are randomly placed ranging from low to high. Then, one at a time, each team member either moves any item one spot lower or higher on the scale or passes their turn. This continues until team members no longer want to move any items.
Characteristics of effective estimation 

Regardless of which technique your team chooses, there are several important characteristics the techniques share that lead to effective estimation:
-
Avoids  gathering false precision of estimates. In Scrum, assigning rough estimates results in more accuracy across the project. Therefore, if the team focuses on identifying relative estimates—rather than a team having a lengthy debate about whether a task will take seven or 10 days of work—the team saves time and avoids potentially missing deadlines.
-
Avoids anchoring bias. Many of these techniques (e.g., Planning Poker) keep the initial estimate private, which allows team members to form an independent opinion on the estimate before sharing their thoughts with the team. This prevents a known phenomenon called anchoring bias, where individuals find themselves compelled to put forth estimates similar to others in the room to avoid embarrassment.
-
Promotes  inclusivity. These group estimation techniques not only lead to better estimates but also help the team develop trust and cohesiveness.
-
Leads to effort  discovery. Estimating in these dynamic ways can help the team uncover strategies to get items completed which might otherwise not have been revealed.
4 Likes
100daysofcode - Day 54
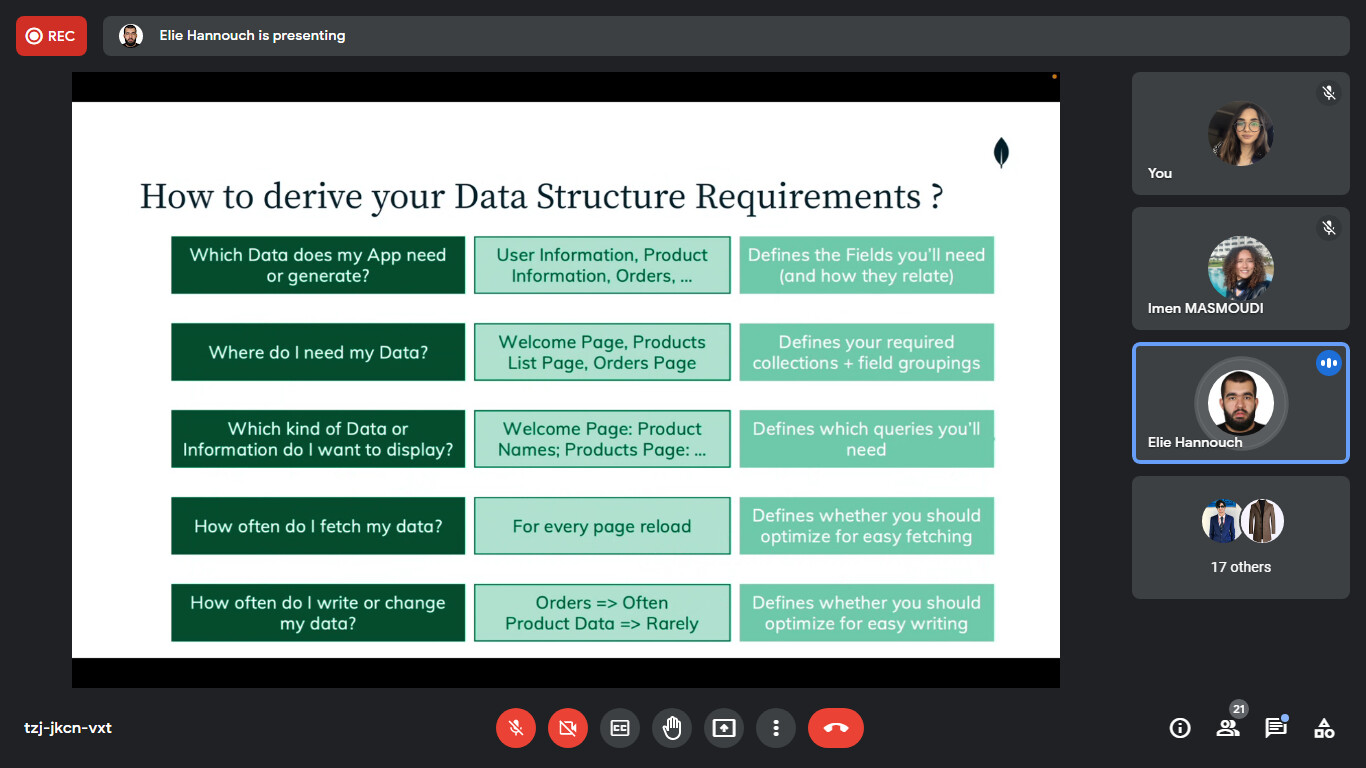
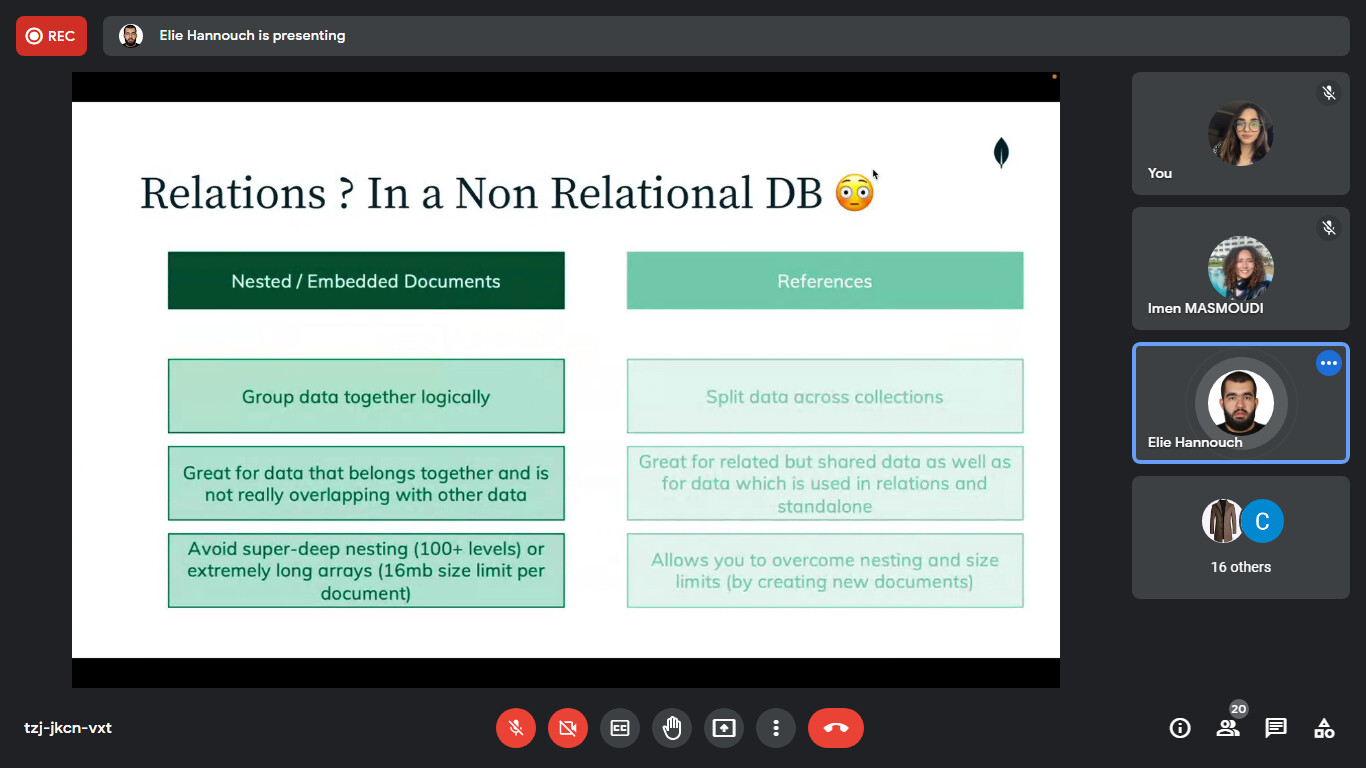
Hello friends the 54th day is already here. Today was not a learning day for me. As it was a special one, talking with the tunisian  community online in a 2h workshop. Invited by there community organizers, it was a honor for me talking about MongoDB
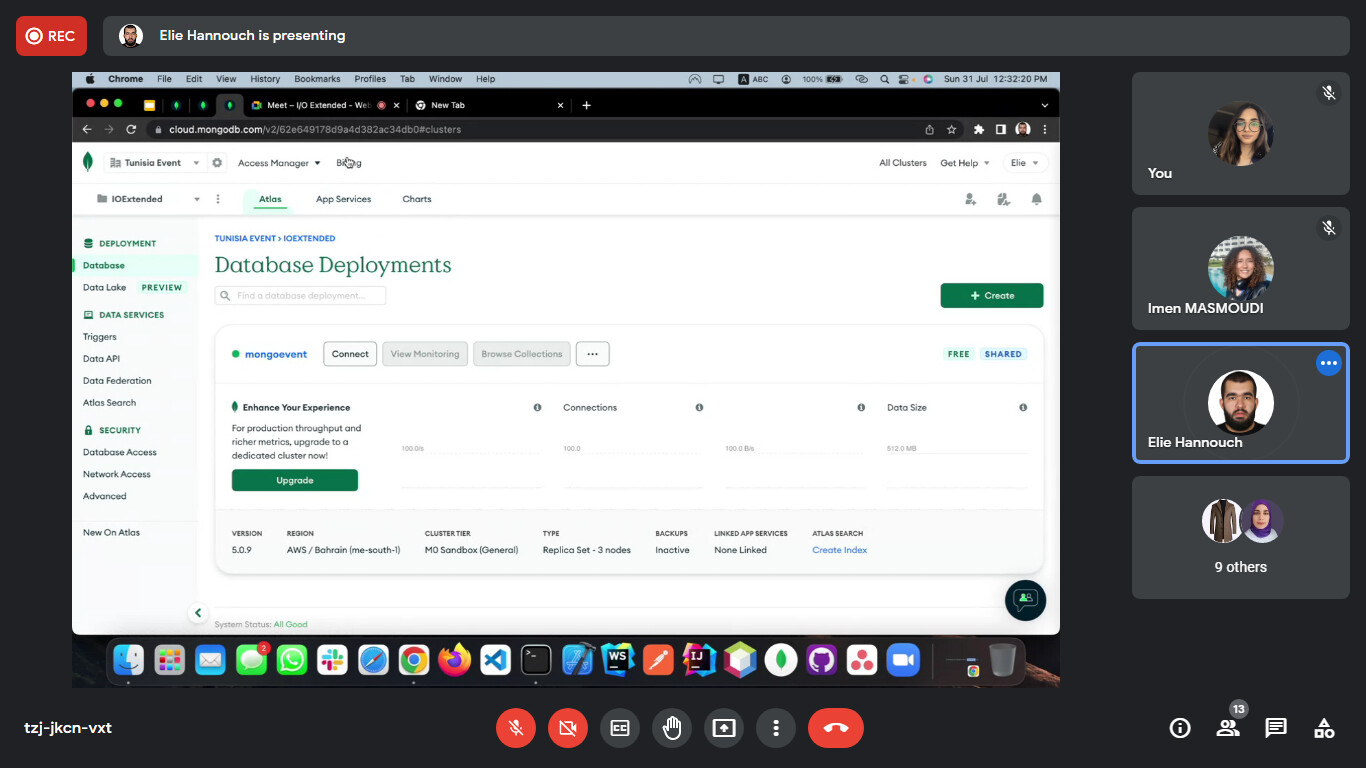
  where we dived together on how to structure and model the data to derive the user requirements, that help us designing an efficient schema for our system. Moving to Atlas
  , exploring the different deployment options to take the maximum advantage from our multi cloud database allowing our system to scale with ease.
Here are some sneak peeks  from the e-workshop, with a special thanks to @Darine_Tleiss and @abedattal for joining me on there off day facilitating the session
4 Likes
100daysofcode - Day 55
Hello friends the 55th day is here, let learn some amazing stuffs and extend our knowledge. In today post we will explore the  major steps in the data analytics process, that help us as project managers understanding the business’ needs and the challenges to determine the effective solutions.
There are six main steps involved in data analysis: Ask, prepare, process, analyze, share and act. Let’s break these down one by one.
-
During the Ask  phase, ask key questions to help frame your analysis, starting with: What is the problem? When defining the problem, look at the current state of the business and identify how it is different from the ideal state. Usually, there is an obstacle in the way or something wrong that needs to be fixed. At this stage, you want to be as specific as possible. You also want to stay focused on the problem itself, not just the symptoms.
-
Another part of the Ask stage is identifying your stakeholders and understanding their expectations. There can be lots of stakeholders on a project, and each of them can make decisions, influence actions, and weigh in on strategies. Each stakeholder will also have specific goals they want to meet. It is pretty common for a stakeholder to come to you with a problem that needs solving. But before you begin your analysis, you need to be clear about what they are asking of you.
- After you have a clear direction, it is time to move to the Prepare stage. This is where you collect and store the data you will use for the upcoming analysis process.

-
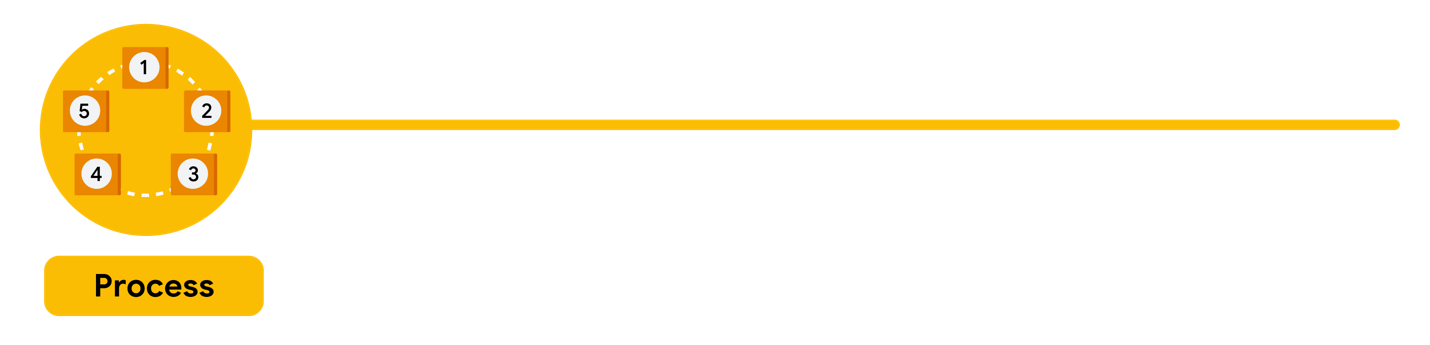
This stage is when it is time to Process your data . In this step, you will “clean” 
 your data, which means you will enter your data into a spreadsheet, or another tool of your choice, and eliminate any inconsistencies and inaccuracies that can get in the way of results. While collecting data, be sure to get rid of any duplicate responses or biased data. This helps you know that any decisions made from the analysis are based on facts and that they are fair and unbiased.
-
During this stage, it is also important to check the data you prepared to make sure it is complete and correct and that there are no typos or other errors.
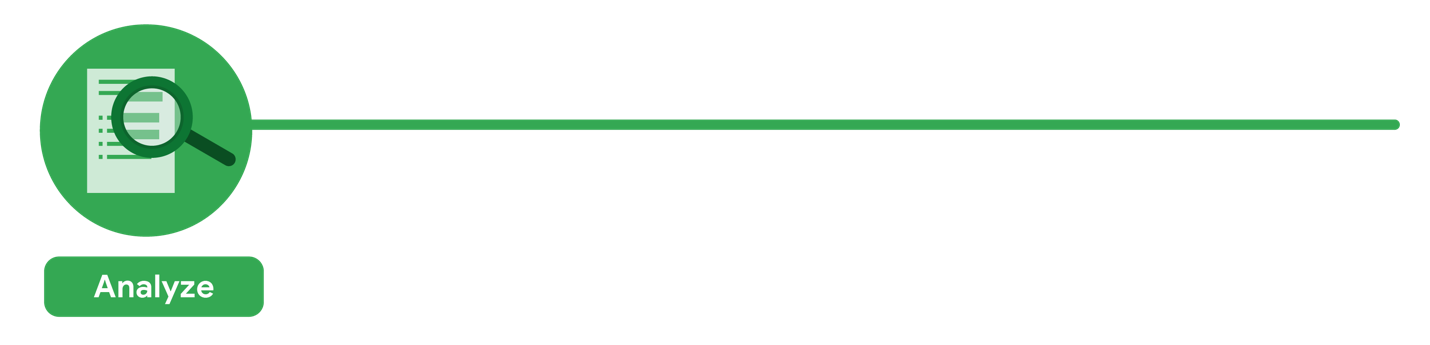
- Now it is time to Analyze
 . In this stage, you take a close look at your data to draw conclusions, make predictions, and decide on next steps. Here, you will transform and organize the data in a way that highlights the full scope of the results so you can figure out what it all means. You can create visualizations using charts and graphs to determine if there are any trends or patterns within the data or any need for additional research.
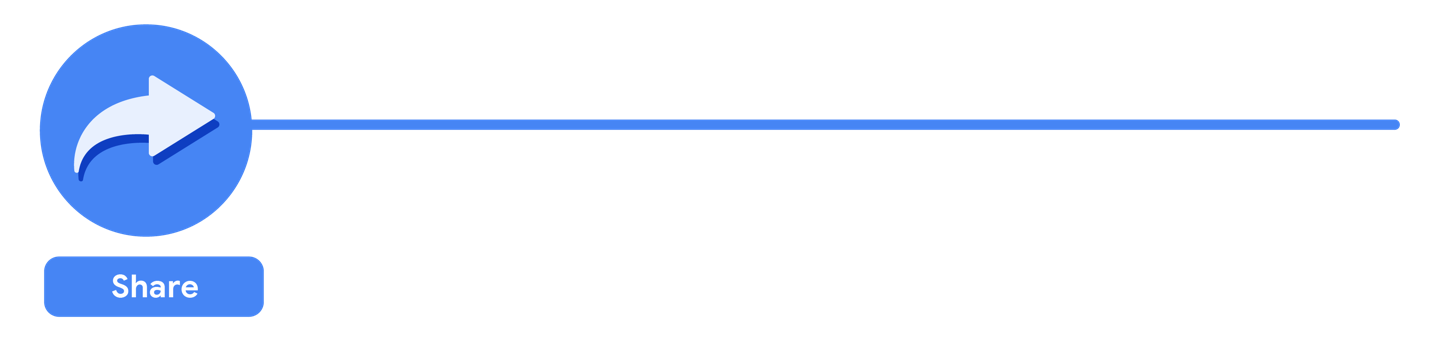
- Once you have asked questions to figure out the problem—then prepared, processed, and analyzed the data—it is time to Share your findings. In this stage, you use data visualization to organize your data in a format that is clear and digestible for your audience. When sharing, you can offer the insights you gained during your analysis to help stakeholders make effective, data-driven decisions for solving the problem.
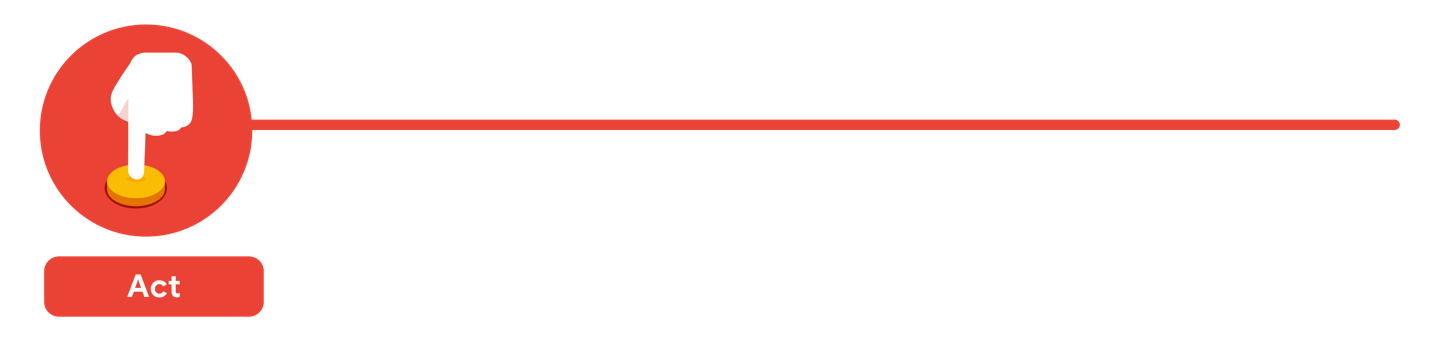
- And finally, you are ready to Act! In the final stage of your data analysis, the business takes all of the insights you have provided and puts them into action to solve the original business problem.
5 Likes
100daysofcode - Day 56
Hello friends, 56/100 is here, extra knowledge are required to wrap the day. In yesterday  post we explored the major steps in the data analytics process, that help us as project managers understanding the business’ needs and the challenges to determine the effective solutions. Today will talk about the best steps to successful end-user adoption
❶ Get an executive champion
- Executive support is key to getting buy-in. People look to your leadership for direction, which is why it’s
important to not only have your executives support your new technology, but use it as well. Leverage executive support at launch by having them send rollout communications, or have them record a video to include in new- hire onboarding. An executive’s level of involvement often can be an indication of the success your new technology will have across your organization. 
❷ Form a cross-functional project team 

- The needs across different departments in an organization can vary, and each may realize different benefits from your solutions. For example, a mobile sales team will appreciate secure access to their apps and data while they’re on the road, and product developers will appreciate the ability to collaborate on files with peers working at remote locations around the world. This is why we recommend forming a cross-functional project team who can evangelize, reinforce leadership’s message, and provide team-specific training as they interface with end users daily.

❸ Build an awareness campaign that gets everybody excited
-
A good communications plan includes a variety of promotional tactics that both inform and generate
excitement about your solutions. Also keep in mind that you have two groups to consider in your plan:
your project team and your end users.
-
Your plan for your project team should include the rollout progress, milestones, and actions,
and acknowledge difficulties and setbacks.
-
Your end user plan should include a cadence of emails from leadership that builds awareness and excitement about your upcoming rollout.
-
In addition to email, it’s important to use additional tactics to keep your users interested and eager for your launch. Some examples include:
-
Posting signage in high-traffic locations, like by the printers or in the break room.
-
Creating a video to loop on a screen by the elevators or in the cafe
-
Creating a “countdown to launch” app on your intranet’s homepage
-
Hosting a preview party to encourage excitement, showcase upcoming trainings, introduce your project team, etc.
❹ Make training role-specific—and fun 
-
Center every session around how and why this new tool paves the way for users to succeed in their particular duties. During a recent research study, we learned that not only do end users want training on how to use new tools, but they want to understand the “why”—what benefit is this new tool going to provide to me? Make sure this is loud and clear in your trainings. Too often, trainings are created with a one-size-fits-all mentality and ultimately fail.
-
When working with your training team, encourage them to train to the roles or departments of your users. And because you have secured executive sponsorship for your launch, utilize their support when building out your training sessions. Consider asking for funding to host interactive sessions, such as lunch-and-learns, snacks and trivia, or an incentives program in which employees earn rewards for active use. Finally, make sure all training materials are easily accessible and repeated often.
❺ Ask for feedback 
- It’s important to build a feedback loop into your plan. Seeking candidate feedback about their experiences
shortly after deployment is a great way to identify people who may not have been properly trained. It also will show them that their concerns are valued and will keep them engaged in the adoption process. 

4 Likes
100daysofcode - Day 57
Hello friends, 57/100 is here, the counter is incrementing and a lot of new knowledge are coming. In yesterday post, we talked about the best steps to successful end-user adoption. While today we will dive in data anonymization and its importance while dealing with users data.
What is data anonymization ? 
- Data anonymization is the process of protecting people’s private or sensitive data by eliminating that kind of information. Typically, data anonymization involves blanking, hashing, or masking personal information, often by using fixed-length codes to represent data columns, or hiding data with altered values.
Your role in data anonymization 

- Organizations have a responsibility to protect their data and the personal information that data might contain. As a data analyst, you might be expected to understand what data needs to be anonymized, but you generally wouldn’t be responsible for the data anonymization itself. A rare exception might be if you work with a copy of the data for testing or development purposes. In this case, you could be required to anonymize the data before you work with it.
What types of data should be anonymized?
- Healthcare
 and financial
  data are two of the most sensitive types of data. These industries rely a lot on data anonymization techniques. After all, the stakes are very high. That’s why data in these two industries usually goes through de-identification, which is a process used to wipe data clean of all personally identifying information.
Data anonymization is used in just about every industry. That is why it is so important for data analysts to understand the basics. Here is a list of data that is often anonymized:
6 Likes
100daysofcode - Day 58
Hello friends, the eight  day from our second half is already here. Our daily counter is increasing and a lot of new knowledge are required in each increment
  . Yesterday we discussed the data anonymization process and its importance while dealing and managing user’s data. Today data modeling levels and techniques.
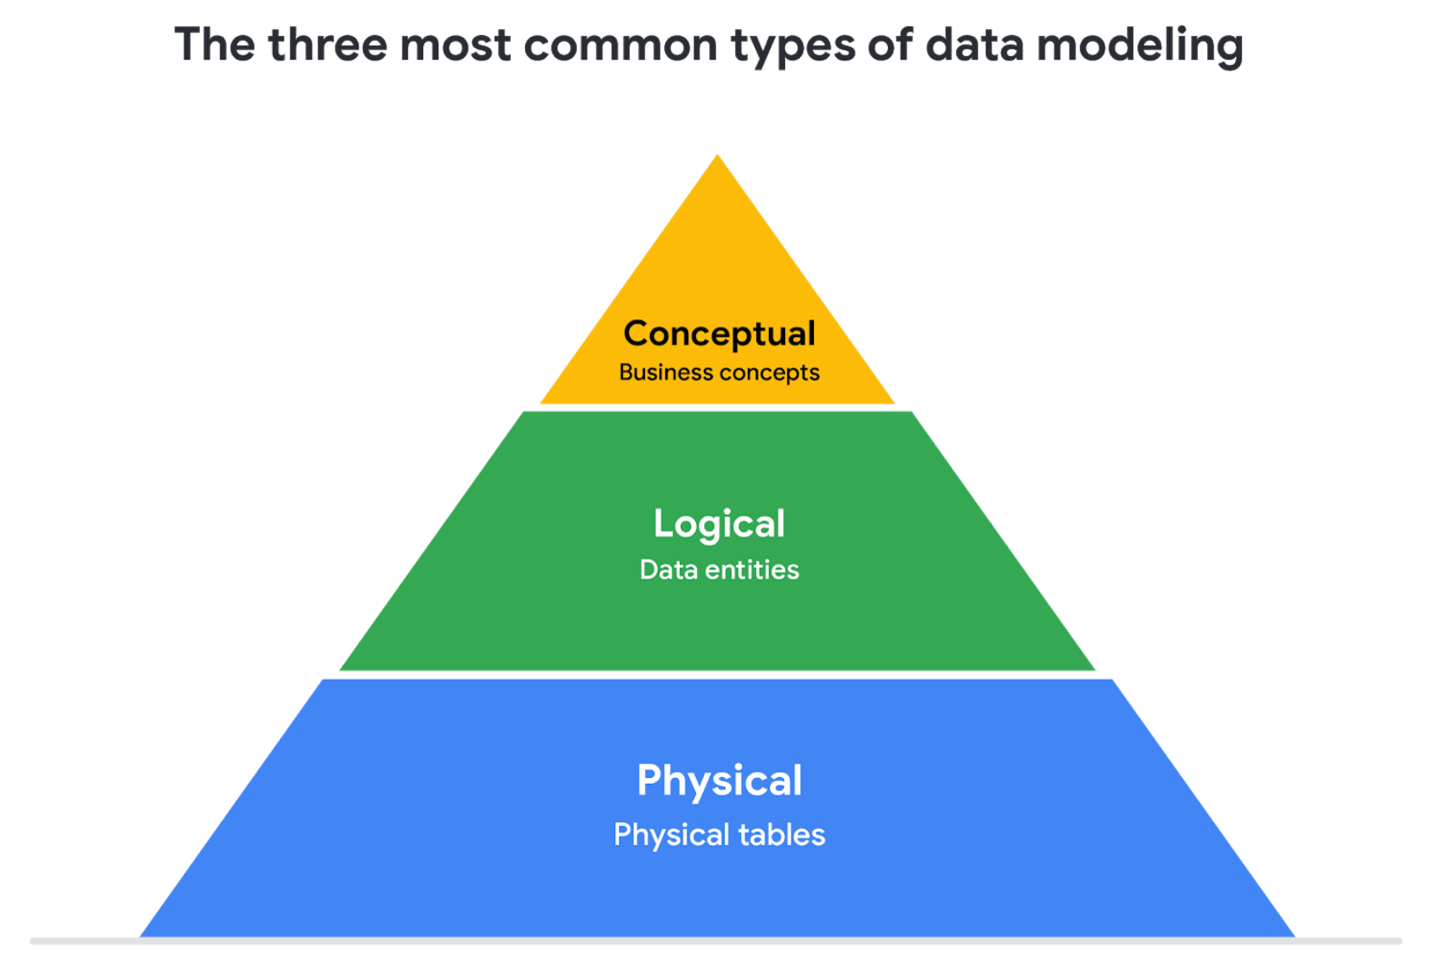
What is data modeling?
Levels of data modeling
Data-modeling techniques 
5 Likes
100daysofcode - Day 59
Hello friends, day++ and a new dive in some new topics in the data world, yesterday we talked about the data modeling levels and the different techniques to do it. Today will discover a new amazing topic “Data limitations” 
Data is powerful , but it has its limitations  . Has someone’s personal opinion found its way into the numbers? Is your data telling the whole story? Part of being a great data analyst is knowing the limits of data and planning for them. This reading explores how you can do that.
- If you have incomplete or nonexistent data, you might realize during an analysis that you don’t have enough data to reach a conclusion. Or, you might even be solving a different problem altogether! For example, suppose you are looking for employees who earned a particular certificate but discover that certification records go back only two years at your company. You can still use the data, but you will need to make the limits of your analysis clear. You might be able to find an alternate source of the data by contacting the company that led the training. But to be safe, you should be up front about the incomplete dataset until that data becomes available.
- If you’re collecting data from other teams and using existing spreadsheets, it is good to keep in mind that people use different business rules. So one team might define and measure things in a completely different way than another. For example, if a metric is the total number of trainees in a certificate program, you could have one team that counts every person who registered for the training, and another team that counts only the people who completed the program. In cases like these, establishing how to measure things early on standardizes the data across the board for greater reliability and accuracy. This will make sure comparisons between teams are meaningful and insightful.
- Dirty data refers to data that contains errors. Dirty data can lead to productivity loss, unnecessary spending, and unwise decision-making. A good data cleaning effort can help you avoid this. As a quick reminder, data cleaning is the process of fixing or removing incorrect, corrupted, incorrectly formatted, duplicate, or incomplete data within a dataset. When you find and fix the errors - while tracking the changes you made - you can avoid a data disaster. You will learn how to clean data later in the training.
-
Compare the same types of data
-
Visualize with care
-
Leave out needless graphs
-
Test for statistical significance
-
Pay attention to sample size
- In any organization, a big part of a data analyst’s role is making sound judgments. When you know the limitations of your data, you can make judgment calls that help people make better decisions supported by the data. Data is an extremely powerful tool for decision-making, but if it is incomplete, misaligned, or hasn’t been cleaned, then it can be misleading. Take the necessary steps to make sure that your data is complete and consistent. Clean the data before you begin your analysis to save yourself and possibly others a great amount of time and effort.
5 Likes
100daysofcode - Day 60
Hello friends, a new day is here, some  knowledge in the amazing data world are required , to wrap the day in an amazing way. Yesterday we talked about the data limitations and how to overcome them. today we will discuss another interesting topic: The Meta data and it’s importance
Metadata is as important as the data itself
-
Take a look at any data you find. What is it? Where did it come from? Is it useful? How do you know? This is where metadata comes in to provide a deeper understanding of the data. To put it simply, metadata is data about data. In database management, it provides information about other data and helps data analysts interpret the contents of the data within a database.
-
-
Regardless of whether you are working with a large or small quantity of data, metadata tells the who, what, when, where, which, how, and why of data 
 .
.
Elements of metadata  𖢞
𖢞
Metadata examples
In today’s digital world, metadata is everywhere, and it is becoming a more common practice to provide metadata on a lot of media and information you interact with. Here are some real-world examples of where to find metadata:
-
Photos:  Whenever a photo is captured with a camera, metadata such as camera filename, date, time, and geolocation are gathered and saved with it.
-
Emails: 
 When an email is sent or received, there is lots of visible metadata such as subject line, the sender, the recipient and date and time sent. There is also hidden metadata that includes server names, IP addresses, HTML format, and software details.
-
Spreadsheets and documents  : Spreadsheets and documents are already filled with a considerable amount of data so it is no surprise that metadata would also accompany them. Titles, author, creation date, number of pages, user comments as well as names of tabs, tables, and columns are all metadata that one can find in spreadsheets and documents.
-
Websites 
 : Every web page has a number of standard metadata fields, such as tags and categories, site creator’s name, web page title and description, time of creation and any iconography.
-
Digital files  : Usually, if you right click on any computer file, you will see its metadata. This could consist of file name, file size, date of creation and modification, and type of file.
3 Likes
100daysofcode - Day 61
Hello friends, 61/100 is already here, new informations are ready and a lot of fun is on the way. After talking yesterday about the metadata and it’s types, Today we will discuss the structure of the data and what are the different types.
Data is everywhere and it can be stored in lots of ways.
Two general categories of data are:
-
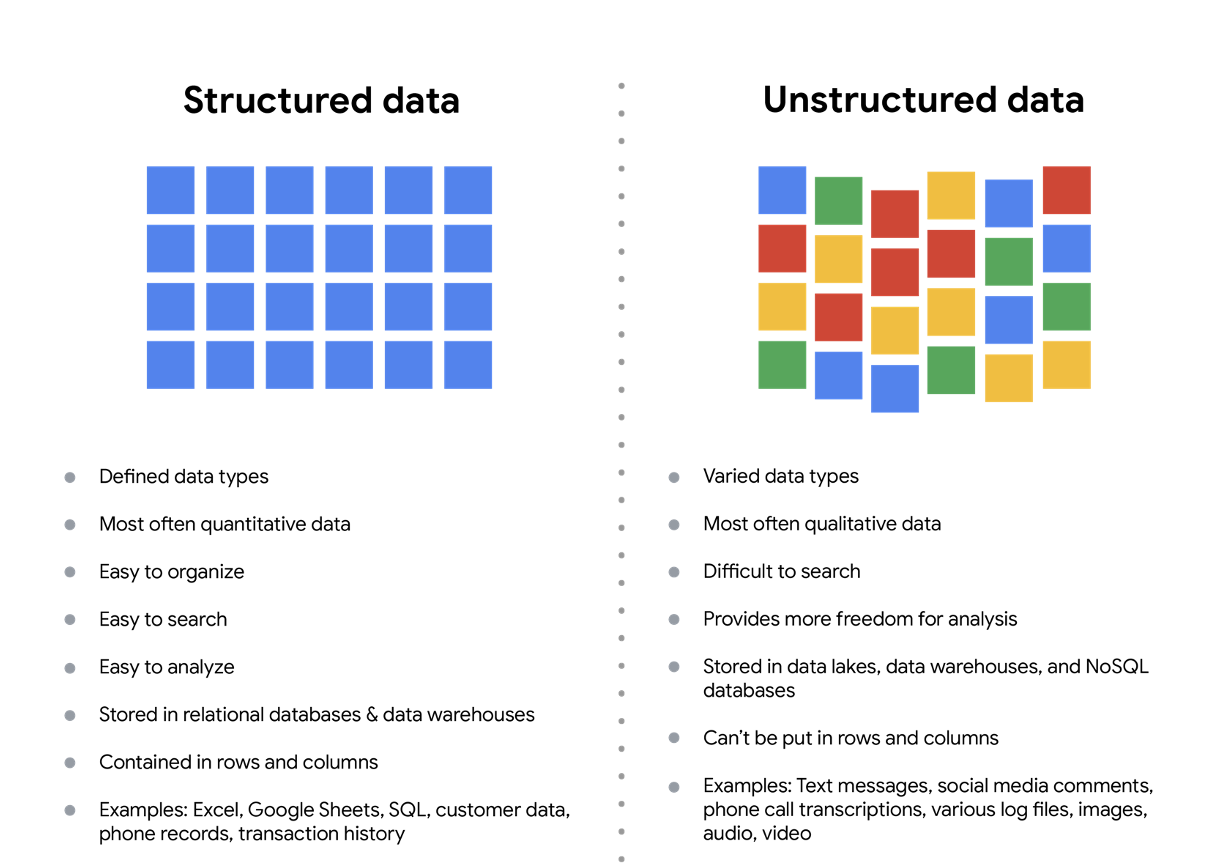
Structured data: Organized in a certain format, such as rows and columns.
-
Unstructured data: Not organized in any easy-to-identify way.
-
Example: when you rate your favorite restaurant 
 online, you’re creating structured data. But when you use Google Earth
  to check out a satellite image of a restaurant location, you’re using unstructured data.
Structured vs Unstructured data
-
Structured data: As we described earlier, structured data is organized in a certain format. This makes it easier to store and query for business needs. If the data is exported, the structure goes along with the data.
-
Unstructured data: Unstructured data can’t be organized in any easily identifiable manner. And there is much more unstructured than structured data in the world. Video and audio files, text files, social media content, satellite imagery, presentations, PDF files, open-ended survey responses, and websites all qualify as types of unstructured data.
3 Likes
100daysofcode - Day 62
Hello friends, day++, an increasing counter, and a daily dose of knowledge. Yesterday we discussed the different data structures while today we will discuss what dirty data is all about .
What is dirty data?
-
Dirty data, also known as rogue data, are inaccurate, incomplete or inconsistent data, especially in a computer system or database
-
Dirty data can contain such mistakes as spelling or punctuation errors, incorrect data associated with a field, incomplete or outdated data, or even data that has been duplicated in the database.
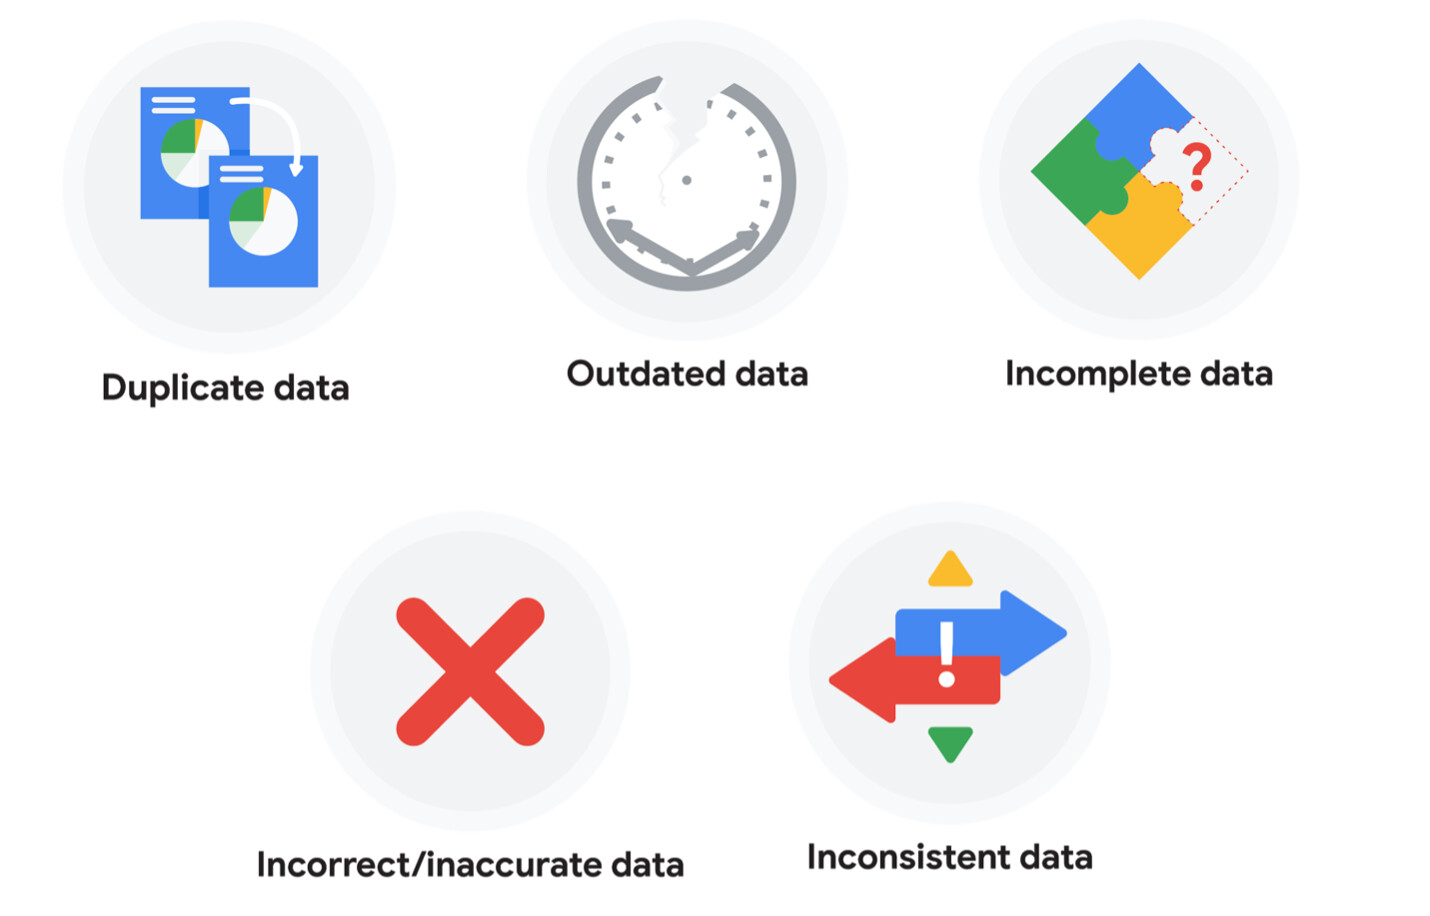
Types of dirty data
Duplicate data 
| Description |
Possible causes |
Potential harm to businesses |
| Any data record that shows up more than once |
Manual data entry, batch data imports, or data migration |
Skewed metrics or analyses, inflated or inaccurate counts or predictions, or confusion during data retrieval |
Outdated data
| Description |
Possible causes |
Potential harm to businesses |
| Any data that is old which should be replaced with newer and more accurate information |
People changing roles or companies, or software and systems becoming obsolete |
Inaccurate insights, decision-making, and analytics |
Incomplete data
| Description |
Possible causes |
Potential harm to businesses |
| Any data that is missing important fields |
Improper data collection or incorrect data entry |
Decreased productivity, inaccurate insights, or inability to complete essential services |
Incorrect/inaccurate data
| Description |
Possible causes |
Potential harm to businesses |
| Any data that is complete but inaccurate |
Human error inserted during data input, fake information, or mock data |
Inaccurate insights or decision-making based on bad information resulting in revenue loss |
Inconsistent data 
| Description |
Possible causes |
Potential harm to businesses |
| Any data that uses different formats to represent the same thing |
Data stored incorrectly or errors inserted during data transfer |
Contradictory data points leading to confusion or inability to classify or segment customers |
4 Likes
100daysofcode - Day 63
Hello friends, a new day and a deep dive in the world of data. Our counter is increasing toward the 100daysofcode challenge. Yesterday we talked about the dirty data and it’s different types . Today we will discuss The open-data debate .
What is open data ?
In data analytics, open data 
 is part of data ethics, which has to do with using data ethically. Openness refers to free access, usage, and sharing of data. But for data to be considered open, it has to:
-
 Be available and accessible to the public as a complete dataset ❶
-
Be provided under terms that allow it to be reused and redistributed ❷
-
Allow universal participation so that anyone can use, reuse, and redistribute the data ❸
Data can only be considered open when it meets all three of these standards.
The open data debate: What data should be publicly  available
  ?
?
Third-party data 

- Collected by an entity that doesn’t have a direct relationship with the data . You might remember learning about this type of data earlier. For example, third parties might collect information about visitors to a certain website . Doing this lets these third parties create audience profiles , which helps them better understand user behavior and target them with more effective advertising.
Personal identifiable information (PII) 
4 Likes
100daysofcode - Day 64
Hello amazing friends, 64/100, a daily increment and of course a lot of new interesting informations. Yesterday we discussed what open data is all about. Today we will move on to discuss the six problem types.
Six problem types ??
- Data analytics is so much more than just plugging information into a platform to find insights
 . It is about solving problems. To get to the root of these problems and find practical solutions, there are lots of opportunities for creative thinking. No matter the problem, the first and most important step is understanding it. From there, it is good to take a problem-solver approach to your analysis to help you decide what information needs to be included, how you can transform the data, and how the data will be used.
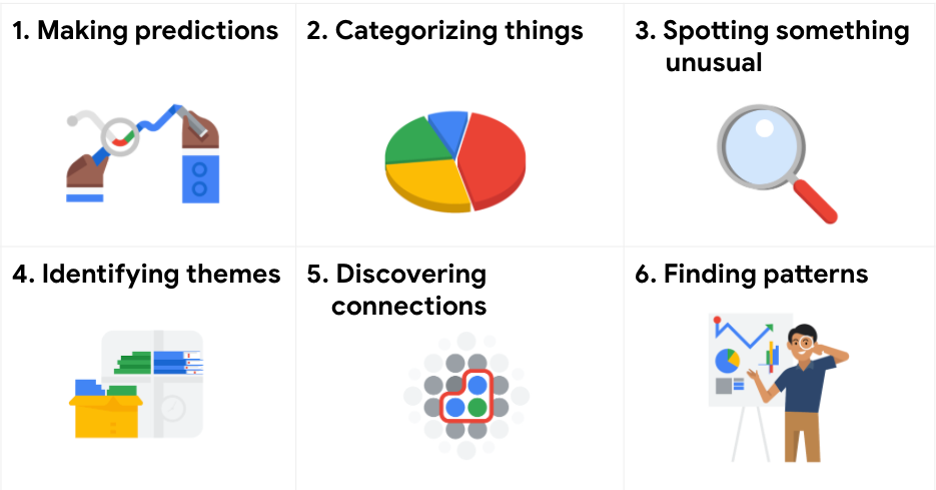
Data analysts typically work with problem types 
- Making predictions : A company that wants to know the best advertising method to bring in new customers is an example of a problem requiring analysts to make predictions. Analysts with data on location , type of media , and number of new customers
 acquired as a result of past ads can’t guarantee future results, but they can help predict the best placement of advertising to reach the target audience.
-
Categorizing things : An example of a problem requiring analysts to categorize things is a company’s goal to improve customer satisfaction. Analysts might classify customer service calls based on certain keywords or scores. This could help identify top-performing customer service representatives or help correlate certain actions taken with higher customer satisfaction scores.
-
Spotting something unusual : A company that sells smart watches that help people monitor their health would be interested in designing their software to spot something unusual. Analysts who have analyzed aggregated health data can help product developers determine the right algorithms to spot and set off alarms when certain data doesn’t trend normally.
-
Identifying themes : User experience (UX) designers might rely on analysts to analyze user interaction data. Similar to problems that require analysts to categorize things, usability improvement projects might require analysts to identify themes to help prioritize the right product features for improvement. Themes are most often used to help researchers explore certain aspects of data. In a user study, user beliefs, practices, and needs are examples of themes.
-
Discovering connections : A third-party logistics company working with another company to get shipments delivered to customers on time is a problem requiring analysts to discover connections. By analyzing the wait times at shipping hubs, analysts can determine the appropriate schedule changes to increase the number of on-time deliveries.
-
Finding patterns:  Minimizing downtime caused by machine failure is an example of a problem requiring analysts to find patterns in data. For example, by analyzing maintenance data, they might discover that most failures happen if regular maintenance is delayed by more than a 15-day window.
4 Likes
100daysofcode - Day 65
Hello friends, 65/100, a lot of knowledge and fun . Everyday, a increment and a lot of new topics to discover in this amazing e-world . Today we will move from the data world, for a quick and gentle tour in the world of WEB3 and how it differ from the Web 1 & 2 .
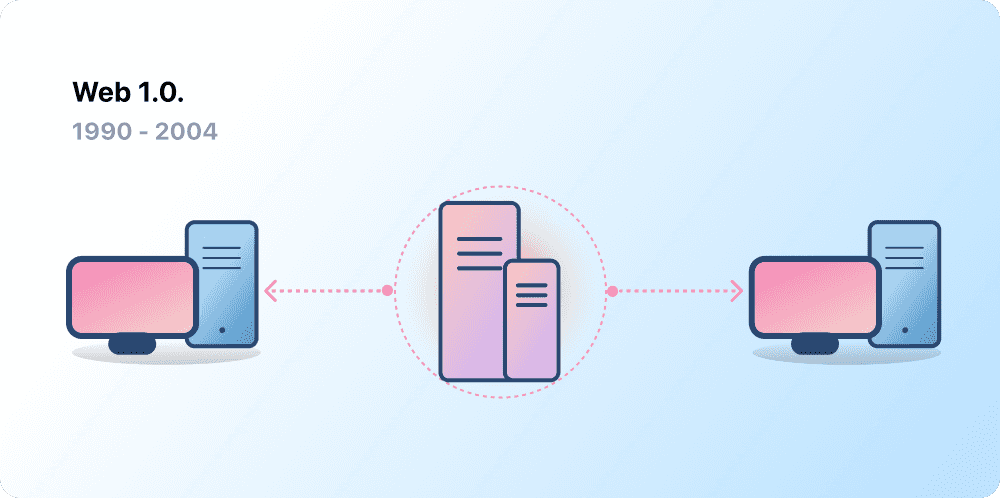
Web 1.0:Read only 
- Referred as Syntactic web or read only web is the era(1990-2004) where the role of a user is limited to reading information provided by the content producers.
- There is no option given for user or consumer to communicate back the information to the content producers.
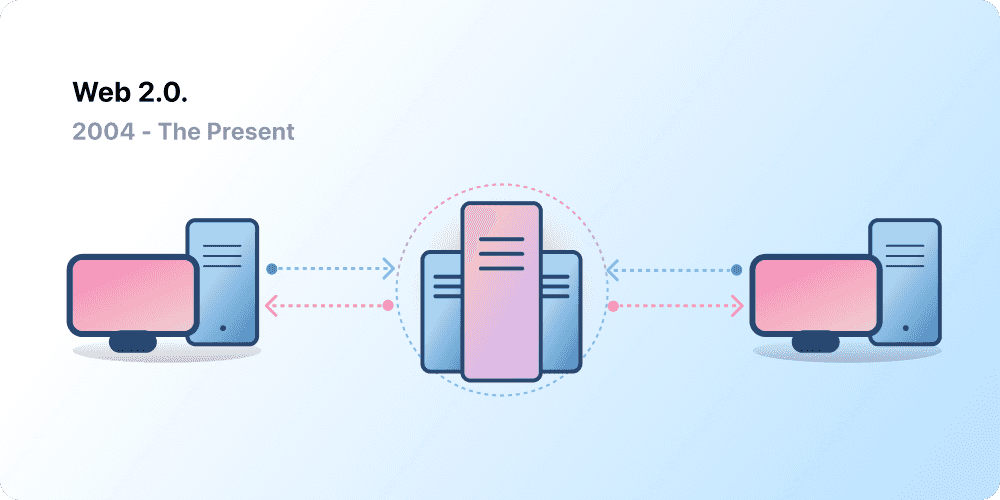
Web 2.0: Read and write
- Began in 2004 with the emergence of social media platforms to allow user-generated content and engage in user-to-user interactions instead of providing read only informations.
- Web 2.0 also birthed the advertising-driven revenue model. $💰
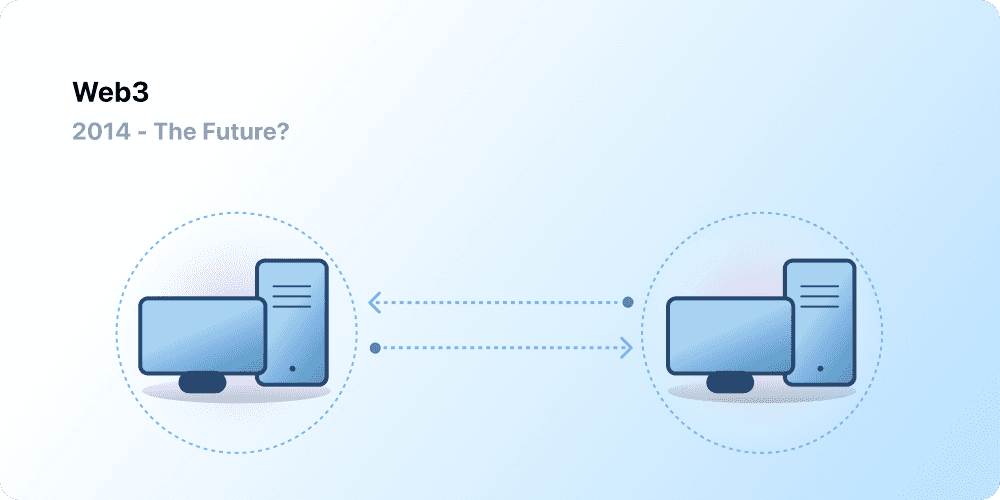
Web 3.0: Read-Write-Own
- The internet required too much trust. That is, most of the internet that people know and use today relies on trusting a handful of private companies to act in the public’s best interests.
- Web 3.0 is built upon the core concepts of decentralization, openness, and greater user utility.
What is Blockchain?
-
Blockchain is a peer-to-peer network that does not require a centralized entity to work. The peers within the network can transact. To validate the transactions, each blockchain uses consensus algorithms. 
-
Blockchain’s other feature is immutability. It ensures that no data is changeable once it is written. Other key features of blockchain technology include transparency and trust.
Stay tuned, for the coming posts, we will dive in the blockchain world, in deep way
5 Likes
100daysofcode - Day 66
Day++, the 66th is here, and our journey with the blockchain and WEB3 is running with a lot of fun and excitement . Today we will talk about the blockchain architecture, and how it work in details.
Blockchain Architecture
- A blockchain is divided into
 primary parts:
-
Blocks
-
Transactions
-
Consensus
01 - Blocks ▇
-
A blockchain is composed of blocks. The blocks are stored in a linear fashion where the latest block is attached to the previous block. Each block contains data — the structure of the data stored within the block is determined by the blockchain type and how it manages the data
-
Also, the first block of any blockchain is known as the Genesis block. Only the genesis block doesn’t have any preceding block.
-
Each block’s structure can be divided into three parts, including the data, hash, and the previous block hash.
02 - Transactions
-
A transaction takes place within the network when one peer sends information to another peer. It is a key element of any blockchain, and without it, there would be no purpose of using a transaction.
-
A transaction consists of information, including the sender, receiver, and value. It is similar to a transaction done on modern credit card platforms. The only difference is that the transaction here is done without a centralized authority.
03 - Consensus 
-
The last important part of blockchain architecture is consensus. It is the method through which a transaction is validated. Each blockchain can have a different consensus method attached to it.
-
Where these algorithms offer a set of rules. It needs to be followed by everyone in the network. Also, to impose a consensus method, nodes should participate. Without any node participation, the consensus method cannot be implemented.
5 Likes
100daysofcode - Day 67
Hello friends, the 67th from 100 is here and our gentle dive in the world of web3 and blockchain is still running. . Today we will discuss the work process of the blockchain, in addition to its different types. .
How Does Blockchain Work
-
In the first step, a transaction is requested  . The transaction can be either to transfer information or some asset of monetary value.
-
A block is created █ to represent the transaction. However, the transaction is not validated yet.
-
The block with the transaction is now sent to the network  nodes. If it is a public blockchain, it is sent to each node.
-
The nodes now start validating according to the consensus method used. In the case of bitcoin, Proof-of-Work (PoW) is used.
-
After successful validation, the node now receives a reward  based on their effort.
-
The transaction is now complete.
Types of Blockchain Architecture 
5 Likes
100daysofcode - Day 68
Hello friends, the 68th from 100 is here we are diving more into the Web3 & Decentralization .
Core idea behind Web3
- Decentralization : in blockchain, Decentralization refers to the transfer of control and decision-making from a centralized entity (individual, organization, or group thereof) to a distributed network. Decentralized networks strive to reduce the level of trust that participants must place in one another, and deter their ability to exert authority or control over one another in ways that degrade the functionality of the network.
- Trustless : A trustless system means that the participants involved do not need to know or trust each other or a third party for the system to function. In a trustless environment, there is no single entity that has authority over the system, and consensus is achieved without participants having to know or trust anything but the system itself.
And many others we will discover them in details in next post 
3 Likes
100daysofcode - Day 69
Hello friends, a new day is here . And as promised in our 69th day we will dive in the concept of decentralization exploring its concepts, and the benefits of implementing it.
Benefits of Decentralization in Blockhain
-
Real-time data distribution and reconciliation : Data in a decentralized network are distributed in real-time. That leaves absolutely no option for data loss or incorrect data. Therefore, even if there’s some non-relevant or incorrect data in the network. It could be easily eliminated by sending the correct copy of the data.
-
Eliminate dependency on a single entity : Decentralization provides an equal amount of power, authority, and responsibility to each member of the network. Hence, shifting the power and dependency from a central entity to all the members in the network. In brief, it’s for the network and by the network.
-
Reduces the chances of massive failure : In the case of a centralized network, if the central entity gets disrupted. The following connected nodes get down as well. Hence, led to network shut down or failure. However, in a decentralized network, it greatly reduces the chances of the whole system getting down at once.
-
Faster transactions : Transaction in a decentralized network is much faster than in a centralized network. As it skips over the intermediate processing and transactions. Hence, results in faster transactions.
-
Trustless yet cooperated ecosystem : A decentralized network eliminates the need to trust another party. Each network member carries the exact same copy of data. Hence, even if a node gets corrupted or tampered with. It will be either be corrected or be rejected by other members of the network collectively.
But… Decentralization is not a sure bet. It could prove to be a troublesome exercise if not carried out in a proper way. Since the entire network is dependent on the model of decentralization, dark web users choose to transact on the blockchain network. Which deeply poisoned the reputation of blockchain technology and its usage.
Disadvantages of Decentralisation
- 51% Attack – A network where nodes control 51% of overall computation.
- Bugs and loopholes in the protocol or consensus mechanism where hackers can exploit the network.
- Compromised Internet Service Providers (ISPs) can lead to routing attacks.
- Sybil Attacks – A network where a single party owns a massive number of nodes in the complete network.
- Direct Denial-of-Service where hackers can fill up the network with high traffic volume. Hence, destroying or redirecting a legit request.
How can it be avoided?
Following are the countermeasures to avoid the above attacks.
- The network needs a monitoring or surveillance system to detect abnormal behavior.
- Security and consensus protocols should be more up-to-date and protected.
- Need a process to check network protocol codes before launching anything.
- Participants should not use the same login password for long. In addition, avoid login from foreign or unfamiliar systems to the network.
- Users should be able to report any bug found on the system.
3 Likes
100daysofcode - Day 70
Hello friends, the 70th day is already here. We are about reaching the happy ending , and as everyday a lot of new knowledge are required. Today we will discuss the difference between 3 main terms: Centralized - Decentralized and Distributed exploring how they differ .
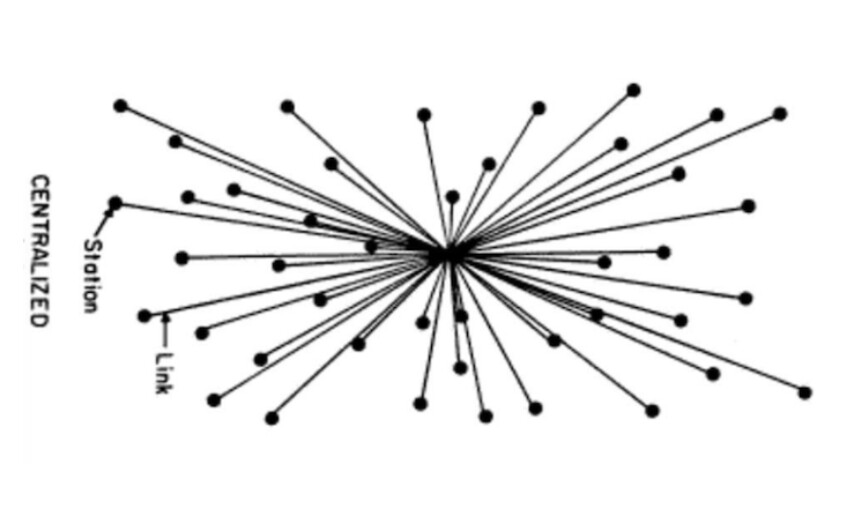
Centralized Systems
-
Most of the Internet applications we use every day are centralized, they are owned by a particular company or person that provision and maintain the source code to execute on a computer, server or maybe even a cluster.
-
-
Centralized applications are the majority of applications that engineers are used to building and users are used to using.
-
Data resides on a centrally owned database controlled by a company. You ultimately have to trust that this company is doing things correctly and in your interest.
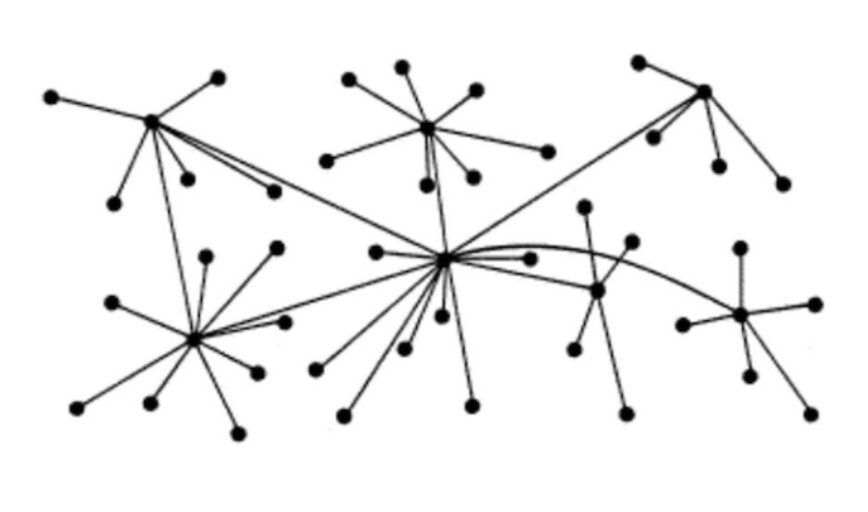
Decentralized Systems🤩
-
Distributed means computation is spread across multiple nodes instead of just one. Decentralized means no node is instructing any other node as to what to do.
-
-
The code runs on a peer-to-peer network of nodes and no single node has control over the dApp. Depending on the functionality of the dApp, different data structures can be used to store the application data. Bitcoin uses a blockchain decentralized ledger of transactions.
Distributed Systems
2 Likes
100daysofcode - Day 71
Hello folks, the 71th /100 of this amazing journey is here . A lot of fun, knowledge and consistency exist in our daily posts, aiming to reach the 100 in a happy way .
Today, the post is short 🫣, and it’s not about learning anything new or sharing any new knowledge. Today I’m happy to announce to you all that I started planning my free youtube serie, aiming to teach my fellows MongoDB with NodeJS, in a long series of free videos that will be delivered in Arabic as a support to the MENA youth and tech enthusiasts that have problems in understanding english. 
My first step is done, thinking how to start the course on youtube, planning to start with the Basics of both MongoDB and NodeJS, them moving on to learn by doing where we will move to build different projects that help the learners understanding different business logics, and starting a complete project from zero to hero  .
.
Any idea, or recommendation is much appreciated, I promise you all an amazing youtube course that will leave some impact in this amazing community and of course such thing cannot happen without your help and support  .
.
Waiting your shinny ideas 
5 Likes
100daysofcode - Day 72
Hello friends, the 72th / 100 day is already here. And some new informations are needed to wrap the day in an amazing way. Yesterday I announced to you all that I’m about starting a new NodeJS and MongoDB course for the community. And the planning is started by writing the syllabus and starting to prepare some demos to be used in the course alongside with the slides that will explain the theory part.
Today I started preparing the JS crash course that will serve as a prerequisite to the main course, where we will make a gentle tour on the JS basics, moving to the functions, classes and learning more about ES6 before moving to NodeJS.
I’m planning to make each lecture, started with some theory and then moving to prove this theory by coding the demo.
What do you think guys ?
Any recommendations
4 Likes