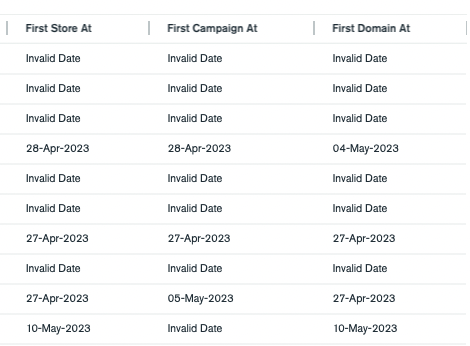
I’m creating a report to track an onboarding process, where for each user we can see the date they created their first store/campaign etc.
In the aggregation for this chart view, I’ve defined the firstStoreCreatedAt field by first using a lookup stage to join my stores collection, sorting by createdAt in the process, and then taking the first element.
[
  {
    $lookup: {
      from: "hot_store_configs",
      let: {
        id: "$_id",
        createdAt: "$hot_store_configs.createdAt",
      },
      pipeline: [
        {
          $match: {
            $expr: {
              $eq: ["$merchantId", "$$id"],
            },
          },
        },
        {
          $sort: {
            createdAt: 1,
          },
        },
      ],
      as: "storesLookup",
    },
  },
  {
    $addFields: {
      "stores.firstStoreCreatedAt": {
        $first: "$storesLookup.createdAt",
      },
  },
]
In the output documents of this chart view, if a user has never created a store, the firstStoreCreatedAt field doesn’t exist. In these cases, I want the “First Store At” field in my report to be blank, rather than showing “Invalid Date”.
I feel as though maybe I’m missing a null check or something, any help would be much appreciated!
Hi Fred,
Unfortunately currently there is no good way in app to customise the display of non-validate date for a date type field. We have a table chart enhancement on our product roadmap, so if there is any idea/feedback, please feel free to submit in our feedback engine here
However to work around it, there are two ways you can achieve this.
Option 1: use the query bar in the chart builder which you can run a custom aggregation for this particular chart to convert the date to string and display empty string for null values:
[
  {
    $addFields: {
      dateString: {
        $ifNull: [{ $dateToString: { format: "%d/%m/%Y", date: "$time" } }, ""]
      }
    }
  }
]
Option 2: Given that you are already using the Charts view, you can also add above pipeline segment into your view aggregation pipeline.
When creating the chart, use the newFields created with string type to display in the table.
The difference between above options is that option 1 will apply to a given chart and option 2 will apply to the entire view.
The caveat of using the workaround is that you will lose the date type in which means if you want to use dashboard filter with one of those field, it will be presented with a string filter rather than a date filter. If the table is just for displaying all the record, above workaround should achieve what you need.
Another way I can think of is to assign null value with an early date e.g. 01 January, 1970 00:00:00, and use conditional formatting to make date earlier than x to display with white text color (we don’t support transparent text color). The issue with this approach is that as you hover onto the row, the text will be visible and it also will show up in dark theme if you are embedding the chart/dashboard, though it does preserve the date type.
1 Like