Hi Everyone,
Just wanted to share something nifty that I’ve been working on that everyone is welcome to use or contribute to.
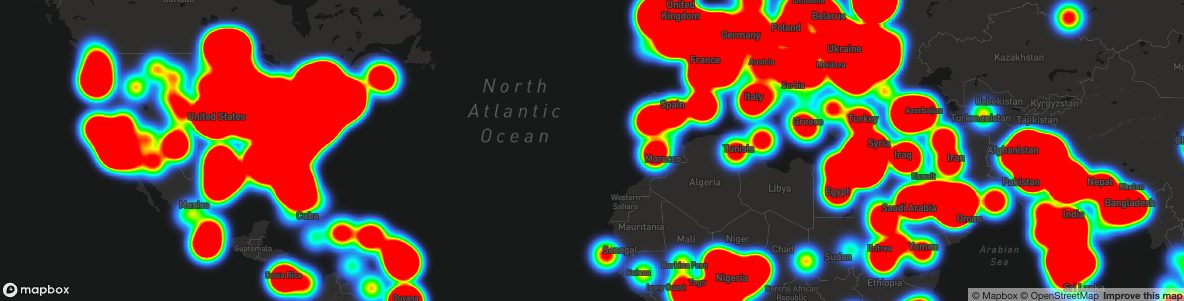
I actually added a heat map of the events found in GDELT. To get an idea of what I’m talking about, take a look at the following image:
To make this possible, I did two things:
- Format the event latitude and longitude data into proper GeoJSON using an an aggregation pipeline.
- Consume the formatted GeoJSON with Mapbox and applying a heat map layer.
So what does my code look like?
Let’s first take a look at the aggregation pipeline that I used to take the point data that exists in each document into a GeoJSON feature array:
[
    {
        "$project": {
            "feature": {
                "type": "Feature",
                "geometry": "$Action.Location"
            }
        }
    },
    {
        "$group": {
            "_id": 1,
            "features": {
                "$push": "$feature"
            }
        }
    },
    {
        "$project": {
            "_id": 0,
            "type": "FeatureCollection",
            "features": 1
        }
    }
]
To make sense of what the aggregation pipeline is doing, I want share what the original data looked like versus the finalized data.
Each document in my collection looked like the following:
{
    "_id": "1037207893",
    "Action": {
        "Geo_Type": "2",
        "Geo_Fullname": "Georgia, United States",
        "Geo_CountryCode": "US",
        "Geo_ADM1Code": "USGA",
        "Location": {
            "type": "Point",
            "coordinates": [-83.6487, 32.9866]
        },
        "Geo_FeatureID": "GA"
    },
    "Actor1": {
        "Code": "LEG",
        "Name": "LEGISLATOR",
        "Type1Code": "LEG",
        "Geo_Type": "2",
        "Geo_Fullname": "Georgia, United States",
        "Geo_CountryCode": "US",
        "Geo_ADM1Code": "USGA",
        "Location": {
            "type": "Point",
            "coordinates": [-83.6487, 32.9866]
        },
        "Geo_FeatureID": "GA"
    },
    "Actor2": {
        "Geo_Type": "0",
        "Location": {
            "type": "Point",
            "coordinates": [0, 0]
        }
    },
    "AvgTone": -0.143678160919539,
    "Day": 20210401,
    "EventBaseCode": "110",
    "EventCode": "110",
    "EventRootCode": "11",
    "FractionDate": 2021.2493,
    "GoldsteinScale": -2.0,
    "IsRootEvent": 1,
    "MonthYear": 202104,
    "NumArticles": 10,
    "NumMentions": 10,
    "NumSources": 1,
    "QuadClass": 3,
    "Year": 2021,
    "internal": {
        "downloadId": "20220401151500"
    },
    "DateAdded": 1648826100000,
    "SourceURL": "https://www.georgiapolicy.org/news/the-myth-of-underfunding/"
}
By the end of the aggregation pipeline, my data was transformed into proper GeoJSON that looked like the following:
{
    "type": "FeatureCollection",
    "features": [
        {
            "type": "Feature",
            "geometry": {
                "type": "Point",
                "coordinates": [-83.6487, 32.9866]
            }
        },
        {
            "type": "Feature",
            "geometry": {
                "type": "Point",
                "coordinates": [-98.5795, 39.828175]
            }
        }
    ]
}
Of course there will be a lot more items in the features array by the end of the aggregation, but that is the format that we’re looking at.
So the GeoJSON is what Mapbox understands and can work with.
Mapbox is not a MongoDB product and does require you to have your own account and API keys. However, you can easily create a heat map of your data doing something like this:
import React, { useRef, useEffect } from "react";
import 'mapbox-gl/dist/mapbox-gl.css';
import mapboxgl from "!mapbox-gl";

const Hero = ({ heatmapData }) => {

    mapboxgl.accessToken = "MAPBOX_ACCESS_TOKEN_HERE";

    const mapContainer = useRef(null);
    const map = useRef(null);

    useEffect(() => {
        if (map.current) return;
        map.current = new mapboxgl.Map({
            container: mapContainer.current,
            style: "mapbox://styles/mapbox/dark-v10",
            center: [
                -20.67,
                34.5994
            ],
            zoom: 2
        });
        map.current.on("load", () => {
            map.current.addSource("news",
                {
                    "type": "geojson",
                    "data": heatmapData
                });
            map.current.addLayer(
                {
                    "id": "news-events",
                    "type": "heatmap",
                    "source": "news"
                },
                "waterway-label"
            )
        });
    });

    return (
        <div className="h-96 rounded-md overflow-hidden bg-cover bg-center relative">
            <div ref={mapContainer} className="h-full" />
        </div>
    );
};

export default Hero;
I’m using React and Next.js for my project so the code above is a mix of the two. If you had to understand just a few things in the above, understand that the heatmapData is the GeoJSON. I’m passing it into this component, but you could easily serve it via an API endpoint and Mapbox would understand what you’re doing. Also don’t forget to swap your access token with my placeholder value.
Hopefully this gives you some ideas for your own project 
// Nic Raboy
