I’m a new MongoDB user (3 days now!) and I’ve got a dashboard with six cards that hold information. I want to be able to do an analysis of the data on a week by week basis to track increases and decreases. Is it possible to go this week to week comparison within MongoDB or not. I know there is the export function, so I can get it in CSV format and do it there, but would like to keep it in Mongo if possible.
Hi @Dustin_Rekunyk welcome to the community!
Could you provide some example data and how the calculation and output should look like?
Best regards
Kevin
1 Like
Hi Kevin:
Thank you for the welcome. Going through the learning assets on here and trying to take in all the information as best as possible.
Planning this out over the last 24 hours, the end state is a chart that shows statistics for the most recent week compared to the previous week.
Example data: (total hits on a website)
total hits to the website previous week - 75
total hits to website this week - 70
decrease in web traffic - 7%
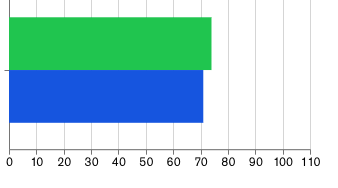
Ideally I would like the output to look something like the attached chart, where last week is on top (green) and this week on the bottom (blue). The chart attached is a generic one, I was playing around with my dashboard last night and was trying different methods without success.
Sounds like MongoDB Charts is the tool for you. Charts can create charts like your example using MongoDB data. There are a couple of tutorials on the bottom of the linked page.
However if you’re using an external tool, then you might need to use the aggregation pipeline to process the data before it’s ready for consumption.
If you’re interested in following a more structured learning method, you might be interested in MongoDB University where there are many free courses on many different topics. For example, I think you might be interested in:
Best regards
Kevin