We are trying to use Mongo c# driver (2.18, 2.22 and 2.23 were tested) in our Unity project (2022.3.10f1), but creating MongoClient instance causes memory leak
By experimenting I found out that speed of leaking depends on heartbeat interval settings, and it reproduces for MultiServerCluster only.
Also amount of read/write requests does not matter. Just creating connection causes constant leak.
Welcome to the MongoDB Community Forums. I understand that you are observing a memory leak when using the 2.18, 2.22, and 2.23 versions of the .NET/C# Driver in a Unity project. You mentioned that the memory leakage rate appears to correlate with the heartbeat frequency with MultiServerCluster instances only.
For Unity Development, we typically recommend our Atlas Device SDK for .NET rather than our .NET/C# Driver. The Driver is intended for server-side usage, not mobile clients or games. Unity is an officially supported platform for the Atlas Device SDKs, but not our drivers. That said, if you are observing a memory leak when using the .NET/C# Driver with Unity, we would be happy to investigate further. A few questions would help to get our investigation started.
You mention that versions 2.18, 2.22, and 2.23 all exhibit this memory leak. Were these the only versions that you tested? Or do earlier versions not exhibit this leak?
You mention that MultiClusterServer instances leak, but not others. To clarify, when the driver is connected to a replica set or sharded cluster, you observe the leak, but not when connected to a standalone instance. Correct?
Do you observe the leak when connected to an Atlas Serverless instance?
Do you observe the leak when compiling for JIT, AOT, or both?
On which operating systems have you observed the leak?
It would be helpful to have a self-contained repro of the issue. Is anything more required than creating a new Unity project and referencing the .NET/C# Driver?
Thanks in advance for your collaboration in investigating this problem.
Thank you for the additional information. It is very helpful to know that this is for game server running a JIT-bsed runtime. I really appreciate the GitHub project demonstrating the problem. I’ve created CSHARP-4971 to investigate this issue. Please follow and comment on that ticket for further information.
I’ve tried to reproduce the problem by using provided project, but I cannot see any problem yet (tested on Windows). I’ve simply started the provided project via Unity Editor with attached build-in Memory Profiler. I can see some allocations but GC seems to collect everything.
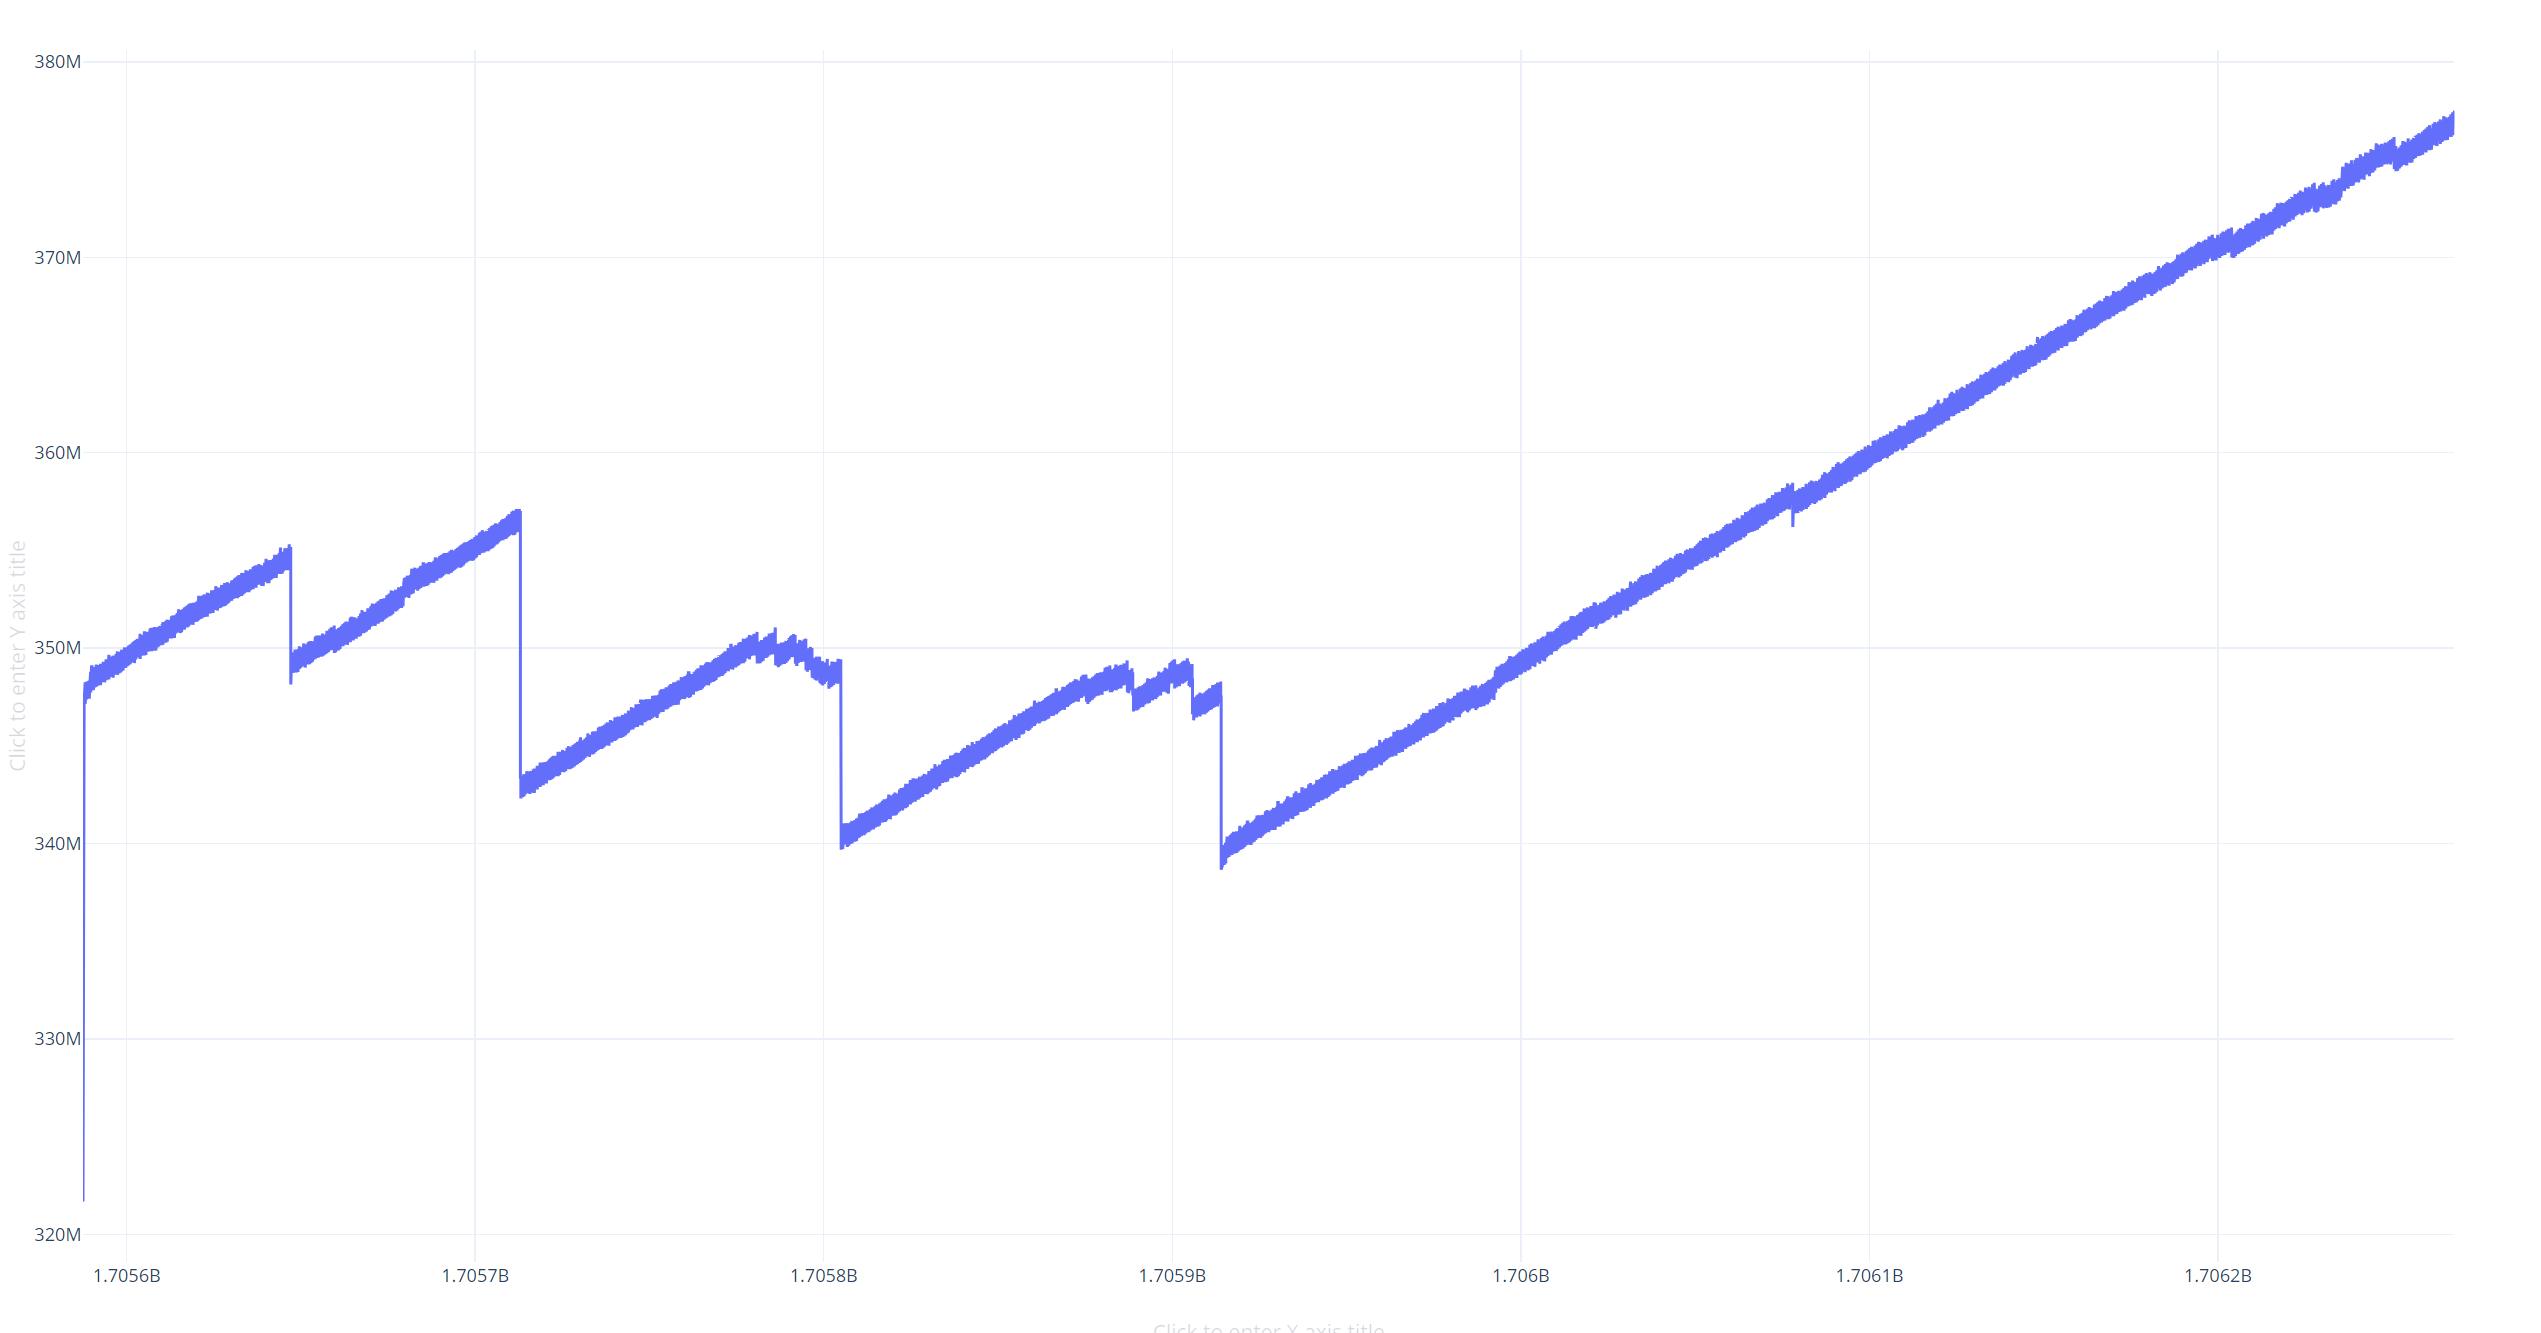
Is there anything else should be done to reproduce the issue (I’m not an Unity expert, so step-by-step instruction would be appreciated)? Also it’s not obvious what the time-scale on the provided memory usage graph, may be I have not wait long enough.
With default settings it can take days. Memory usage graph’s x axis shows billions of seconds, so whole graph is about week. But it can be reproduced much faster by redusing heartbeat interval (e.g. leak with 100ms become obvious in couple hours)
I didn’t try to reproduse it in editor. I built project using dedicated server build for Linux, and monitored it using python script linked below