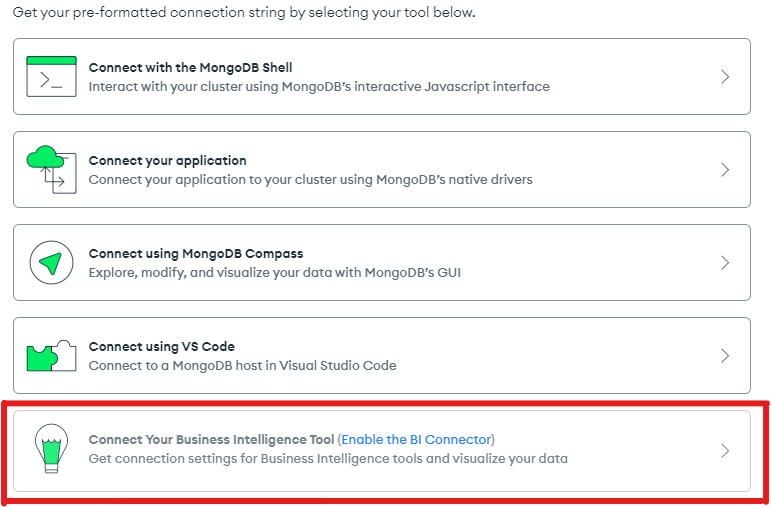
Hi, im a new user of MongoDB Atlas and i have some questions…
I’m using an M10 cluster (2GB RAM, 20GB storage) and would like to do some data visualization tests with BI tools. To use this tool I need to upgrade my current cluster, correct? Is this the only way to use BI tools? Does MongoDB offer some kind of free trial?
Hello @Eduardo_Ferreira
Thanks for your inquiry. The BI Connector is not the only way to do data visualization on Atlas Data. We actually have available (in Preview) the Atlas SQL Interface. Atlas SQL allows users to connect, access, and visualize Atlas Data (clusters, S3 buckets, data lake storage etc.) from SQL-based BI tools. Currently, we have a generic Atlas SQL JDBC Driver and a Tableau custom connector ready for use. We are developing an Atlas SQL ODBC Driver and a Power BI custom connector - these will be available mid year. So if your BI tool is Tableau or Power BI (preview coming in a few months), I would highly suggest trying out these new custom connectors instead of the BI Connector. If your BI tool is something other than Tableau or Power BI, we can look to see if it supports a generic JDBC or ODBC driver for database connection.
Atlas SQL can be used with free tier or shared clusters. There isn’t any cost to turn it on. There can be costs associated with query consumption, but it’s typically small and you may not see any costs if you are just trying it out. Send me an email if you’d like to have a call where I can walk you through the Atlas SQL set up, or just determine if Atlas SQL is right for you. I have included a few links so you can gain some more information on Atlas SQL:
Atlas SQL
Atlas SQL Tableau Connector
Best,
Alexi Antonino
alexi.antonino@mongodb.com
Product Manager, SQL & BI Connector
1 Like
Hi @Alexi_Antonino, thanks for the reply, I will test the Tableau Connector and get back to you in this topic or by email if I have more issues, thank you very much for your help.
Awesome! don’t hesitate to reach out if you get blocked.
Also, I didn’t mention it in my first reply because you seemed to be specifically looking for BI Tool Connection, but MongoDB Charts might also support your needs. “MongoDB Charts is a tool to create visual representations of your MongoDB data. Data visualization is a key component to providing a clear understanding of your data, highlighting correlations between variables and making it easy to discern patterns and trends within your dataset. MongoDB Charts makes communicating your data a straightforward process by providing built-in tools to easily share and collaborate on visualizations.”
Here is link to check out Charts: MongoDB Charts
1 Like
