Atlas v 7 not using indexes as intended

I found a slow query on profiler many Keys Examined and memory sorted this query coming from my nodejs code, but when i run the same query (copy from atlas profiler) in compass it uses the same index but with less key examined and not memory sorted, any help about that?

running Mongodb V7.0.2 atlas M30


This plan summary is from atlas profiler for the same query

  "planSummary": "IXSCAN { districtsOfInterest._id: 1, isVerifiedByNafath: -1, falAuthorizationStatus: 1, subscription.packageName: -1, userActivites.requestsCommuincationsCounts: -1 }, IXSCAN { districtsOfInterest._id: 1, isVerifiedByNafath: -1, falAuthorizationStatus: 1, subscription.packageName: -1, userActivites.requestsCommuincationsCounts: -1 }, IXSCAN { districtsOfInterest._id: 1, isVerifiedByNafath: -1, falAuthorizationStatus: 1, subscription.packageName: -1, userActivites.requestsCommuincationsCounts: -1 }",

Hi @Ahmed_Naser1

Have you tried to run your code with hint option?
This option skips the query plan from mongoDB and uses directly the index that you are suggesting.

This query was performing before updates to Mongo V 7.0?

On your profiler, could you see what index was used on that operation?

1 Like

Hi @Ahmed_Naser1,

In addition to what Jennysson has suggested, can you provide the query being executed that you’ve copied and pasted to test on compass as well as the explain("executionStats") output for this query?

Lastly, please provide a sample document from the collection where this query is being executed.

Redact any personal or sensitive information before posting here.

Regards,
Jason

This query was working fine on V6 and it ls already using the same index on compass and on profiler so the hint option will not help here

This is the part of the model schema that is being used in the query

{
    falAuthorizationStatus: {
      type: String,
    },
    isVerifiedByNafath: {
      type: Boolean,
      default: false,
    },
    status: {
      type: String,
    },
    role: {
      type: String,
      default: 'GUEST',
      trim: true,
    },
    subscription: {
      type: new Schema({
        packageName: { type: String },
      }, { _id: false }),
    },
    districtsOfInterest: {
      type: [new Schema({
        _id: {
          type: Schema.Types.ObjectId,
          ref: 'District',
        },
      }, { id: false })],
      default: [],
    },
    userActivites: {
      requestsCommuincationsCounts: { type: Number, default: 0 },
    },

}

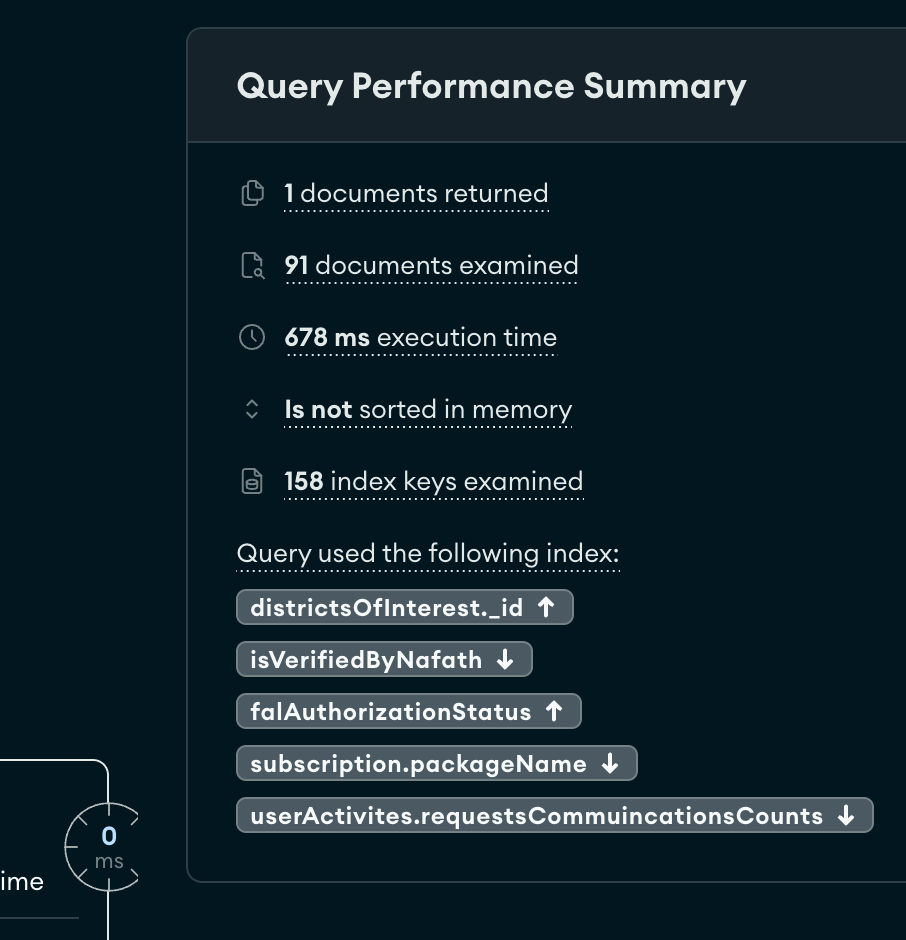
and this is the index used for this query

  schema.index({
    'districtsOfInterest._id': 1,
    isVerifiedByNafath: -1,
    falAuthorizationStatus: 1,
    'subscription.packageName': -1,
    'userActivites.requestsCommuincationsCounts': -1,
  }, {
    partialFilterExpression: {
      role: 'REAL_STATE_AGENT',
      status: 'ACTIVE',
      'subscription.packageName': {
        $in: [
          'PROFESSIONAL_ONE_YEAR',
          'PROFESSIONAL_SIX_MONTH',
          'PROFESSIONAL_THREE_MONTH',
          'PROFESSIONAL_ONE_MONTH',
          'FREE_PROFESSIONAL',
        ],
      },
    },
    name: 'active-professional-agents',
  });

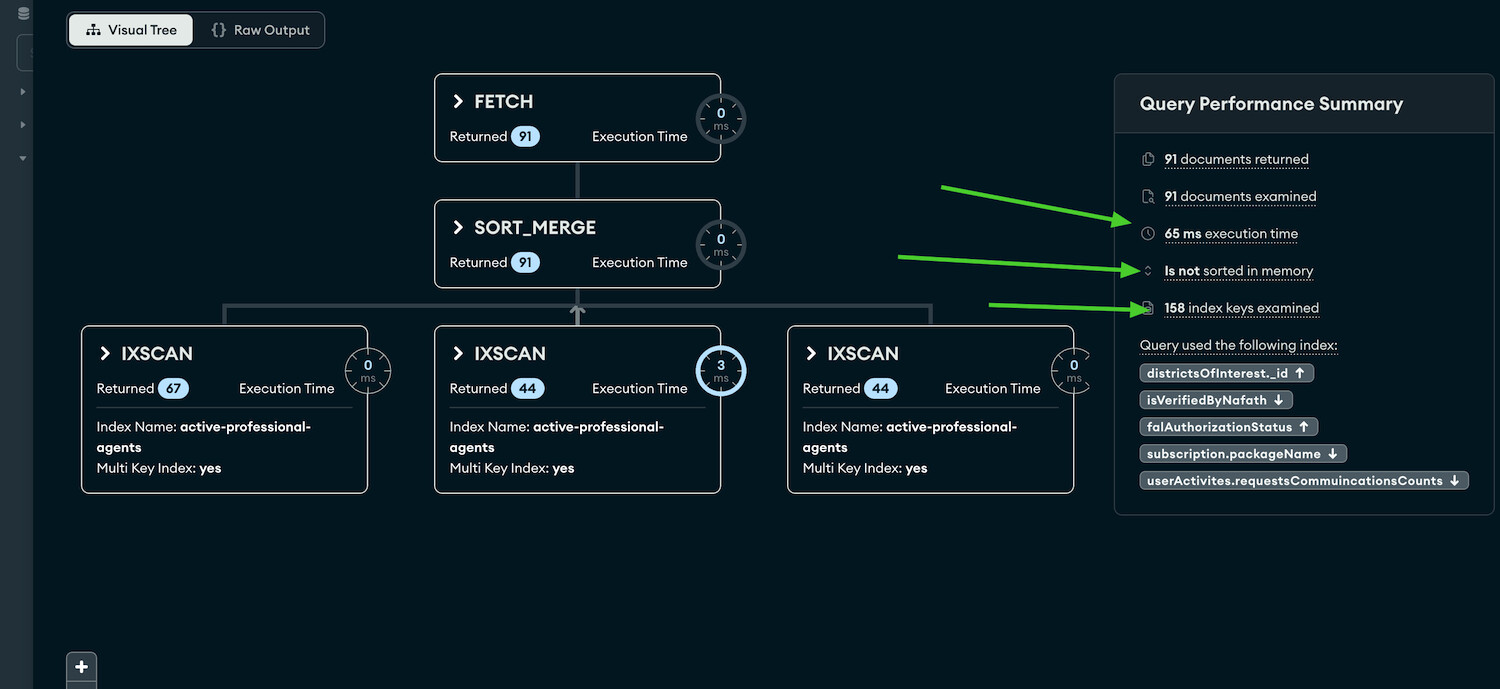
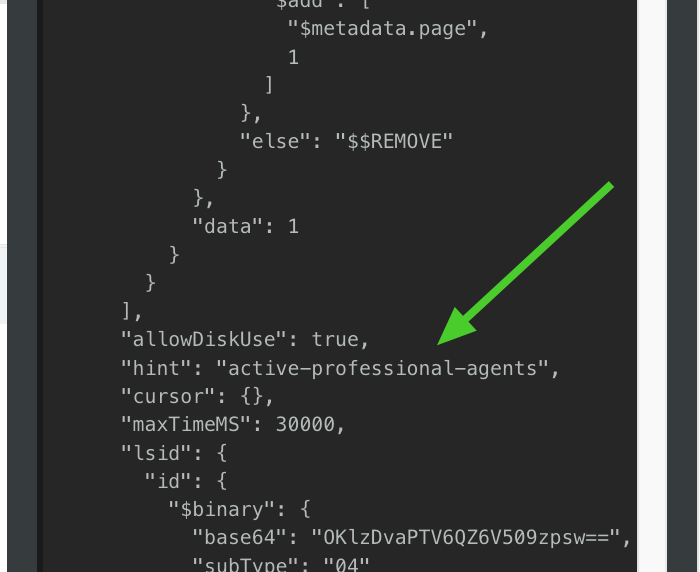
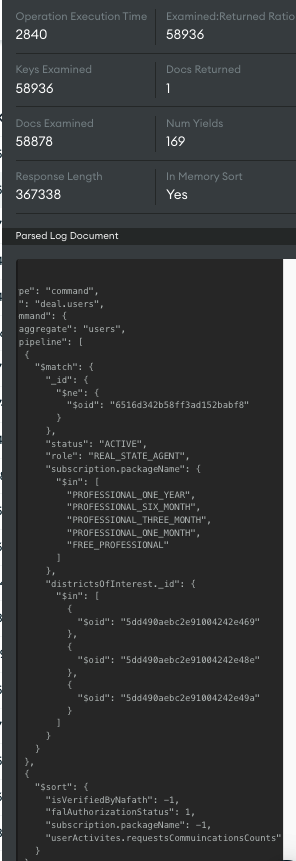
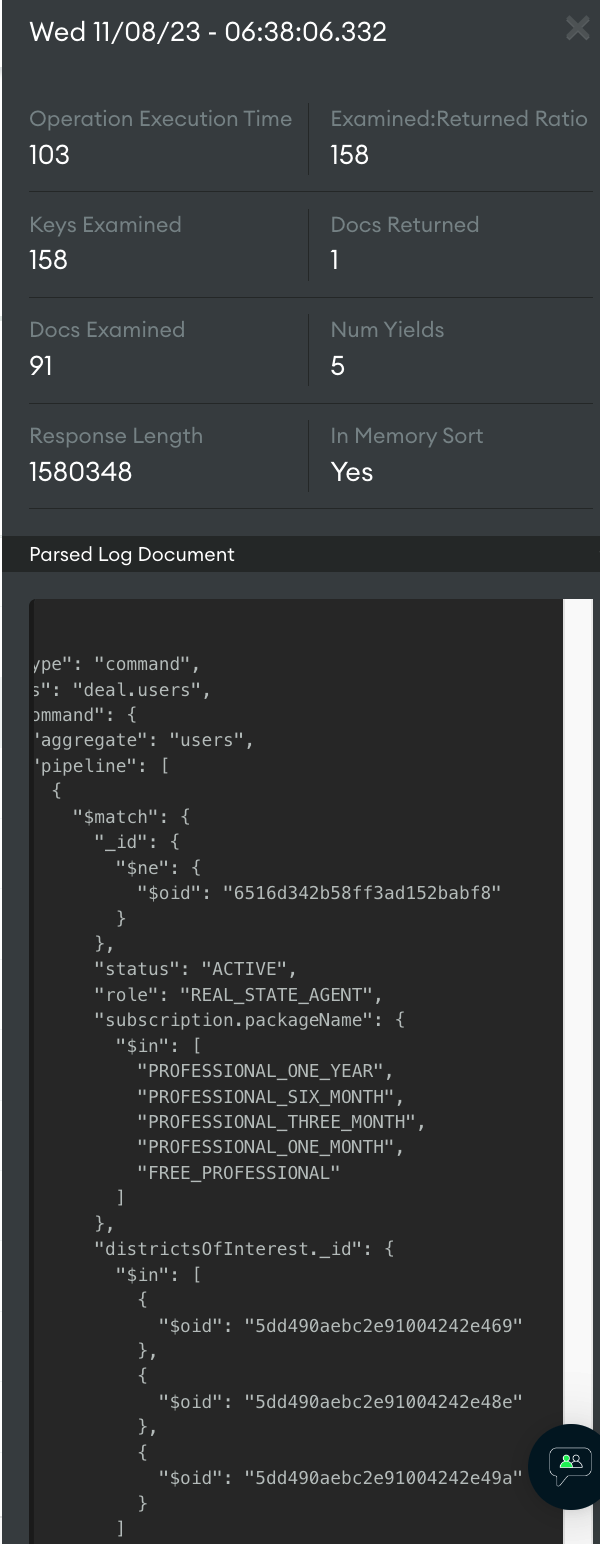
and this is the query with sort

[
  {
    $match: {
      _id: {
        $ne: ObjectId("6516d342b58ff3ad152babf8"),
      },
      status: "ACTIVE",
      role: "REAL_STATE_AGENT",
      "subscription.packageName": {
        $in: [
          "PROFESSIONAL_ONE_YEAR",
          "PROFESSIONAL_SIX_MONTH",
          "PROFESSIONAL_THREE_MONTH",
          "PROFESSIONAL_ONE_MONTH",
          "FREE_PROFESSIONAL",
        ],
      },
      "districtsOfInterest._id": {
        $in: [
          ObjectId("5dd490aebc2e91004242e469"),
          ObjectId("5dd490aebc2e91004242e48e"),
          ObjectId("5dd490aebc2e91004242e49a"),
        ],
      },
    },
  },
  {
    $sort: {
      isVerifiedByNafath: -1,
      falAuthorizationStatus: 1,
      "subscription.packageName": -1,
      "userActivites.requestsCommuincationsCounts":
        -1,
    },
  },
]

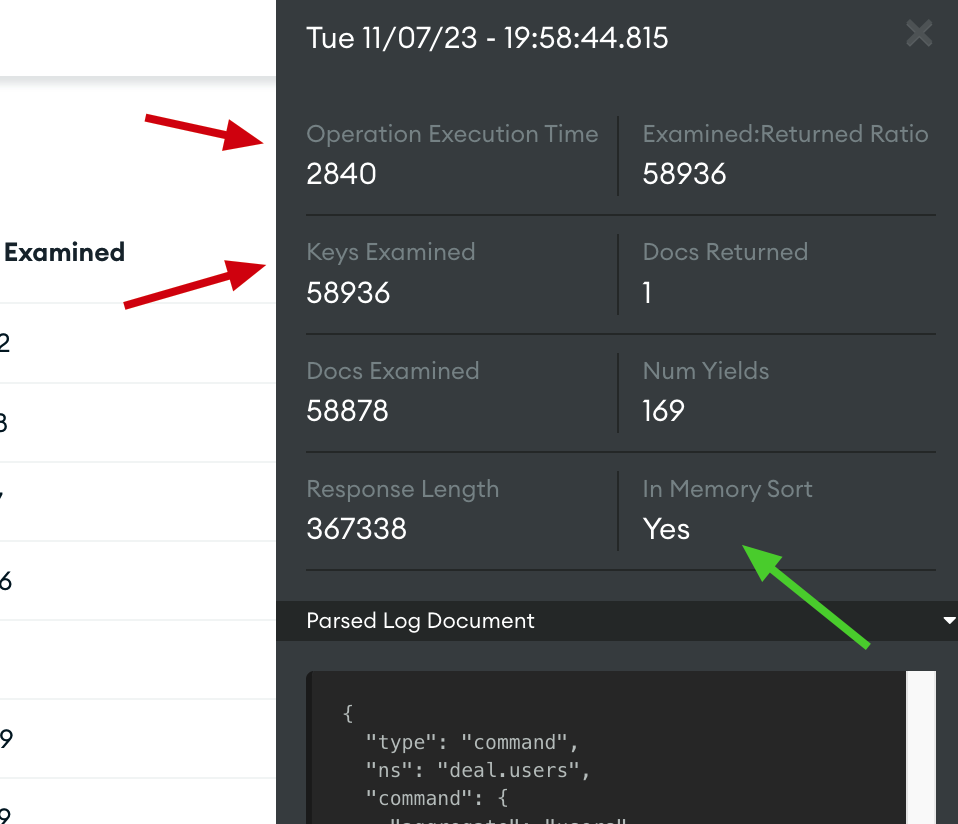
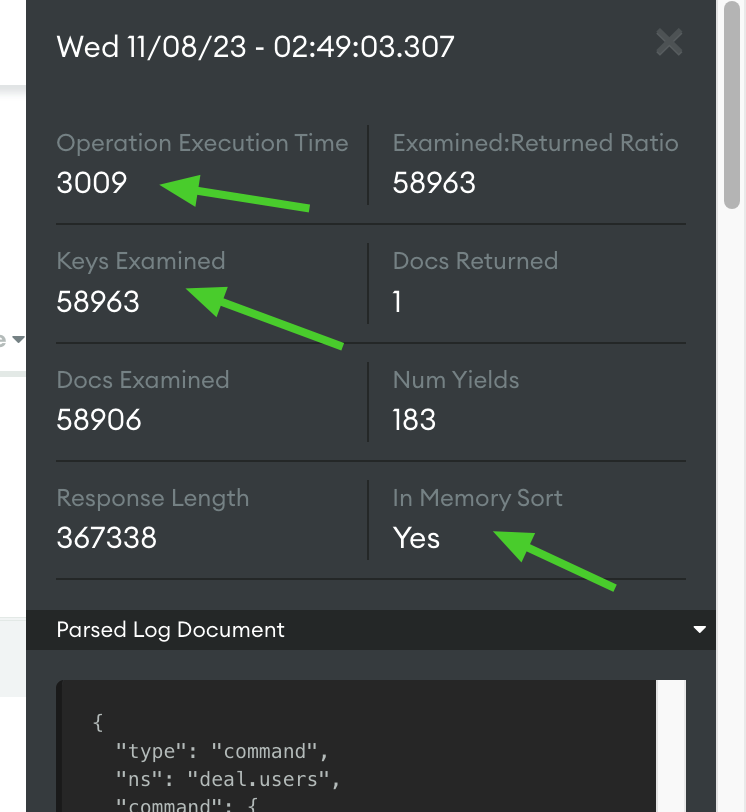
Also here is a json file for execution stats from compass
exeuction-stats-users.json (211.4 KB)

I recommend you take a look at your logs or profiler to check if your query is running with the correct index.

Based on the print from your profiler screen and your compass screen, I suppose that those queries are using different plans on Query Planner.

I have a similar problem and solved using $hint operator to skip query planner and use directly the correct index.

The same index is used when the query is used by compass and the same index inside profile
This is from profiler for the query in the thread

  "planSummary": "IXSCAN { districtsOfInterest._id: 1, isVerifiedByNafath: -1, falAuthorizationStatus: 1, subscription.packageName: -1, userActivites.requestsCommuincationsCounts: -1 }, IXSCAN { districtsOfInterest._id: 1, isVerifiedByNafath: -1, falAuthorizationStatus: 1, subscription.packageName: -1, userActivites.requestsCommuincationsCounts: -1 }, IXSCAN { districtsOfInterest._id: 1, isVerifiedByNafath: -1, falAuthorizationStatus: 1, subscription.packageName: -1, userActivites.requestsCommuincationsCounts: -1 }",

i am testing index hint and it didn’t work


Just for some clarification, the executionstats you’ve provided from Compass, is that from the MongoDB instance that is on version 7? I.e. The query running fine / as you expect it when you execute it against the MongoDB version 7 instance from Compass but the profiler is showing up with a slow query from application?

Or is it that you ran the same query against a MongoDB version 6 instance using Compass.

Look forward to your response.

Regards,
Jason

Both queries made on the same cluster (atlas M30) on the same version (V7) upgraded two days ago on profiler is slow but on compass working perfectly even they are using the same index wether in profiler or compass

tried index hint as suggested by @Jennysson_Junior but did not work as i shown in the above comment

BTW i tested it using latest version of mongoose also same issue did not work on profiler

Okay thank you for clarifying that. So it sounds like when the query is executed from an application (that is not Compass in this scenario), it appears to show up on the profiler as it is logged as a slow operation – Is that correct?

Can you go to this profiler log you provided and advise the exact "command" contents in the Parsed Log Document section shown on the above screenshot? Redact all sensitive information / values before sending here. I wish to compare this to the following query you ran on Compass:

[
  {
    $match: {
      _id: {
        $ne: ObjectId("6516d342b58ff3ad152babf8"),
      },
      status: "ACTIVE",
      role: "REAL_STATE_AGENT",
      "subscription.packageName": {
        $in: [
          "PROFESSIONAL_ONE_YEAR",
          "PROFESSIONAL_SIX_MONTH",
          "PROFESSIONAL_THREE_MONTH",
          "PROFESSIONAL_ONE_MONTH",
          "FREE_PROFESSIONAL",
        ],
      },
      "districtsOfInterest._id": {
        $in: [
          ObjectId("5dd490aebc2e91004242e469"),
          ObjectId("5dd490aebc2e91004242e48e"),
          ObjectId("5dd490aebc2e91004242e49a"),
        ],
      },
    },
  },
  {
    $sort: {
      isVerifiedByNafath: -1,
      falAuthorizationStatus: 1,
      "subscription.packageName": -1,
      "userActivites.requestsCommuincationsCounts":
        -1,
    },
  },
]

If it is not exactly the same, that could be the reason why you’re getting largely different execution times.

Regards,
Jason

It is the same query (match and sort) this was part of aggregation but the most important thing is sort and match, i copied it from profiler

[
      {
        "$match": {
          "_id": {
            "$ne": {
              "$oid": "6516d342b58ff3ad152babf8"
            }
          },
          "status": "ACTIVE",
          "role": "REAL_STATE_AGENT",
          "subscription.packageName": {
            "$in": [
              "PROFESSIONAL_ONE_YEAR",
              "PROFESSIONAL_SIX_MONTH",
              "PROFESSIONAL_THREE_MONTH",
              "PROFESSIONAL_ONE_MONTH",
              "FREE_PROFESSIONAL"
            ]
          },
          "districtsOfInterest._id": {
            "$in": [
              {
                "$oid": "5dd490aebc2e91004242e469"
              },
              {
                "$oid": "5dd490aebc2e91004242e48e"
              },
              {
                "$oid": "5dd490aebc2e91004242e49a"
              }
            ]
          }
        }
      },
      {
        "$sort": {
          "isVerifiedByNafath": -1,
          "falAuthorizationStatus": 1,
          "subscription.packageName": -1,
          "userActivites.requestsCommuincationsCounts": -1
        }
      }
]

Could you slightly scroll down and screenshot the portion under the $sort? It appears there might be another stage(s) after the $sort

it is a facet and it is not affecting anything related to the index usage in match and sort stage

Yeah the Compass query is not including the $facet. The $facet stage appears to be causing the extra keys + documents to be examined when you compare it to the query executed on Compass that does not have use of the same $facet.

Same query with facet stage


and here is execution stats for the same query was on the profiler

exec-stats.json (238.9 KB)

I ignored the facet because i know it is not related, index usage in this aggregation is concerned with match and sort and have no relation with facet, but as i showed in the upper comment same aggregation with different performance

I deployed an M10 cluster on V6 Mongodb and restored the needed collections for the query and tried to fire the aggregation from the application as i did before, and it worked perfectly as shown in the image, this confirms (for me) the issue is related to MongoDB v7, what should i do in this case?

parsed-log-v6.json (9.5 KB)

Hi @Ahmed_Naser1,

Thanks for reporting this issue! My name is Chris and I’m a currently a Product Manager here at MongoDB after spending a number of years on the support team.

The thing that would be most helpful at this point would be if you could gather the "allPlansExecution" verbosity explain output for the (simplified) aggregation (consisting of just the $match and $sort). This verbosity is one step higher than the one previously collected and will give us a better understanding of the decision from the plan selection process. We will need the full text output from that command.

A secondary piece of information which could be useful here is the list of indexes on the collection. While we can usually gather enough information from the explain plan directly, sometimes having the list of indexes improves our ability to be able to reproduce behavior locally.

We look forward to hearing back from you!

Best,
Chris

Hi @Christopher_Harris

Thanks a lot for your help

here is the result for the same query
this is the output of the profiler
profiler-parsed-query.json (3.7 KB)

and here is the full explain for the same query (match and sort)
compass-explain.json (359.4 KB)

and here is a list of all indexes on that collection
users-indexes.json (12.3 KB)

You will notice in profiler report and the explain of compass the same index is used in both of them!
even though there is a bug difference in examined keys

I hope you find the problem here

Regards

@Christopher_Harris Any update on this matter? because queries are taking 3-4 seconds even though it should take way less than that