The insurance industry is undergoing a significant shift from traditional to near-real-time data-driven models, driven by both strong consumer demand, and the urgent need for companies to process large amounts of data efficiently. Data from sources such as connected vehicles and wearables are utilized to calculate precise and personalized premium prices, while also creating new opportunities for innovative products and services.
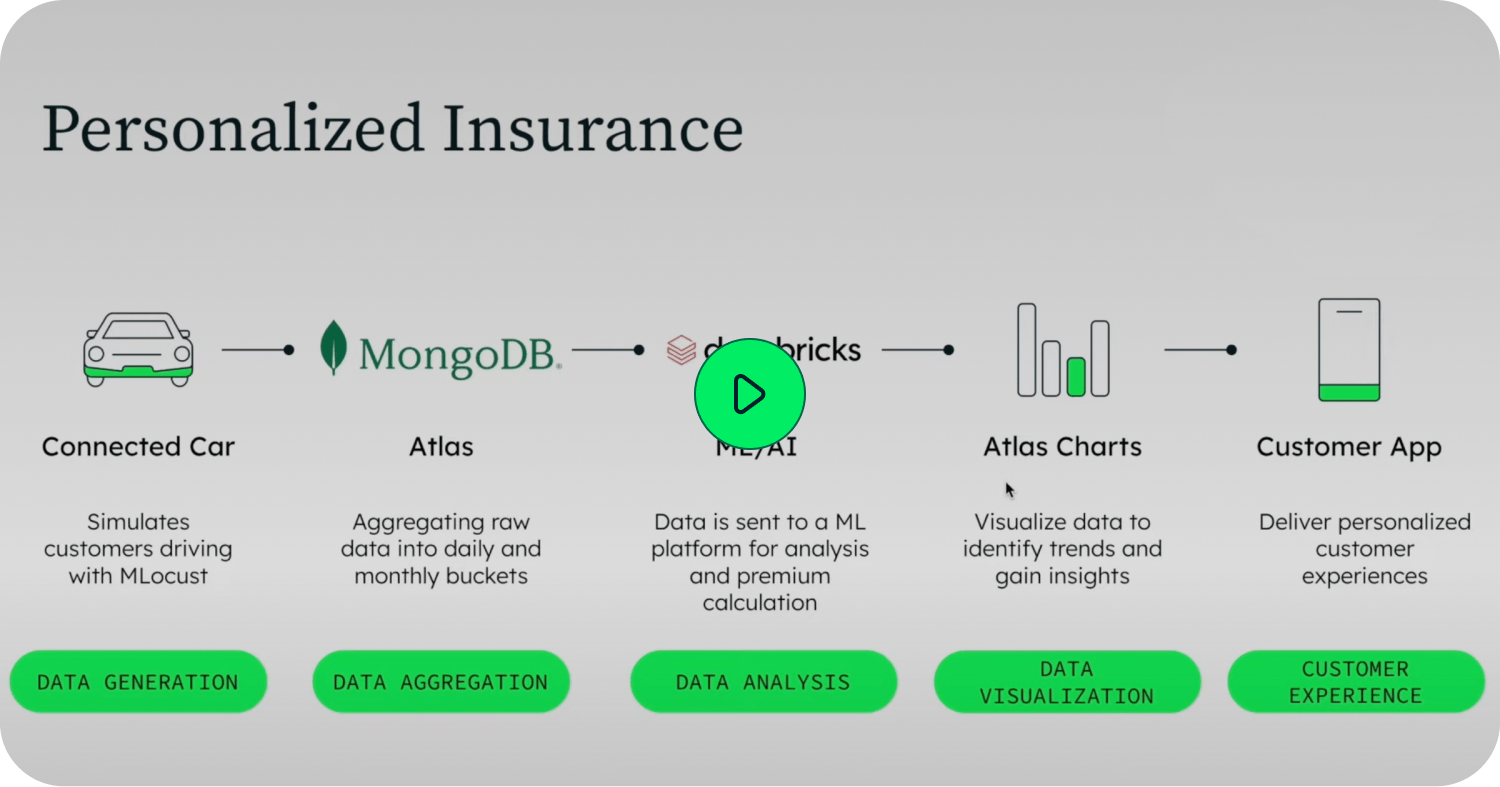
As insurance companies strive to provide personalized and real-time products, the move towards sophisticated and real-time data-driven underwriting models is inevitable. To process all of this information efficiently, software delivery teams will need to become experts at building and maintaining data processing pipelines. This blog will focus on how you can revolutionize the underwriting process within your organization, by demonstrating how easy it is to create a usage-based insurance model using MongoDB and Databricks.
This blog is a companion to the solution demo in our Github repository. In the GitHub repo, you will find detailed step-by-step instructions on how to build the data upload and transformation pipeline leveraging MongoDB Atlas platform features, as well as how to generate, send, and process events to and from Databricks.
Let’s get started.
Part 1: the Use Case Data Model
Part 2: the Data Pipeline
Part 3: Automated Decision Support with Databricks
Part 1: The use case data model
Imagine being able to offer your customers personalized usage-based premiums that take into account their driving habits and behavior. To do this, you'll need to gather data from connected vehicles, send it to a Machine Learning platform for analysis, and then use the results to create a personalized premium for your customers. You’ll also want to visualize the data to identify trends and gain insights. This unique, tailored approach will give your customers greater control over their insurance costs while helping you to provide more accurate and fair pricing.
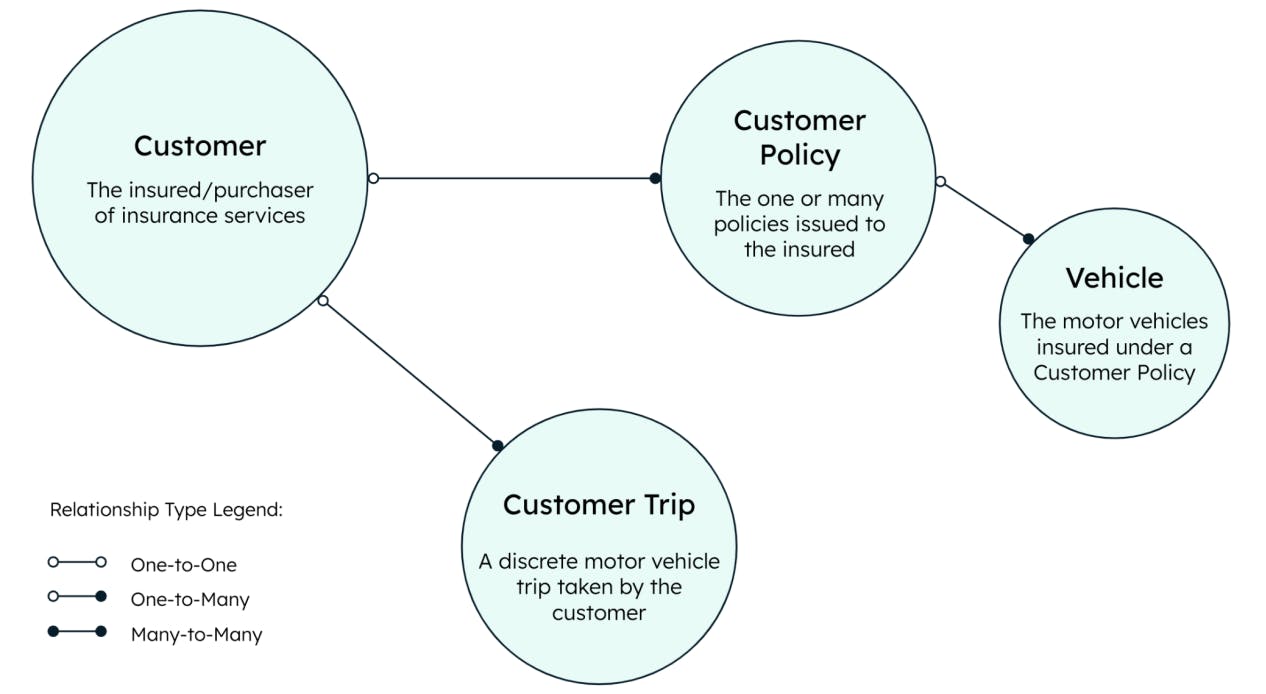
A basic example data model to support this use case would include customers, the trips they take, the policies they purchase, and the vehicles insured by those policies.
This example builds out three MongoDB collections, as well two Materialized Views. The full Hackloade data model which defines all the MongoDB objects within this example can be found here.
Part 2: The data pipeline
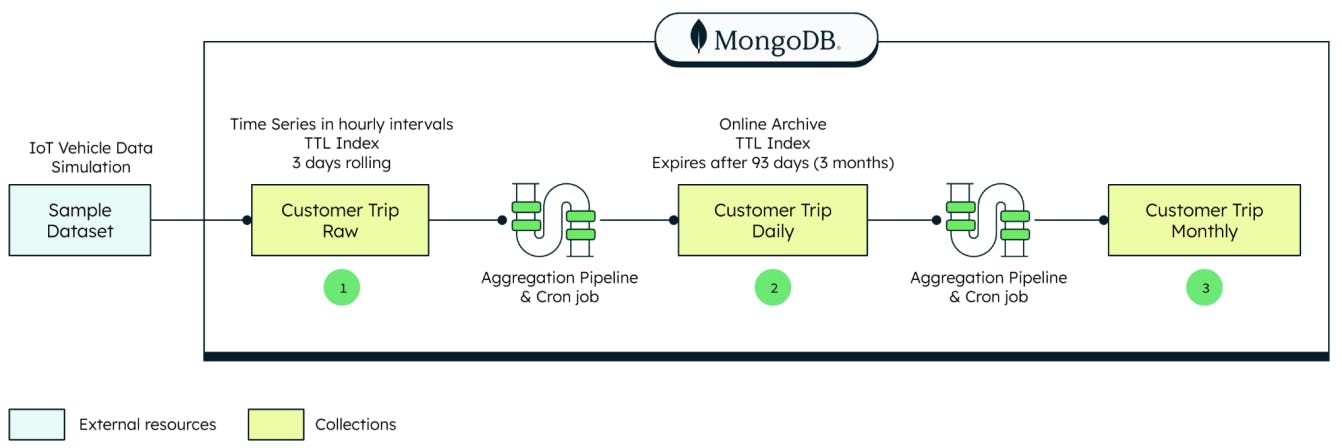
The data processing pipeline component of this example consists of sample data, a daily materialized view, and a monthly materialized view. A sample dataset of IoT vehicle telemetry data represents the motor vehicle trips taken by customers. It’s loaded into the collection named ‘customerTripRaw’ (1) . The dataset can be found here and can be loaded via MongoImport, or other methods. To create a materialized view, a scheduled Trigger executes a function that runs an Aggregation Pipeline. This then generates a daily summary of the raw IoT data, and lands that in a Materialized View collection named ‘customerTripDaily’ (2) . Similarly for a monthly materialized view, a scheduled Trigger executes a function that runs an Aggregation Pipeline that, on a monthly basis, summarizes the information in the ‘customerTripDaily’ collection, and lands that in a Materialized View collection named ‘customerTripMonthly’(3).
For more info on these, and other MongoDB Platform Features:
Part 3: Automated decisions with Databricks
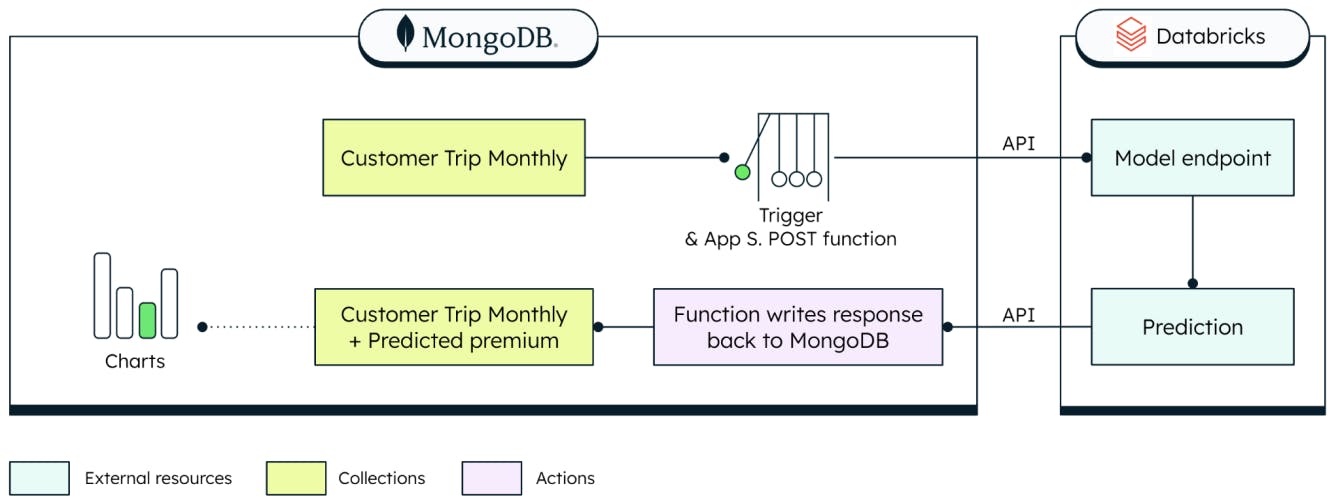
The decision-processing component of this example consists of a scheduled trigger and an Atlas Chart. The scheduled trigger collects the necessary data and posts the payload to a Databricks ML Flow API endpoint (the model was previously trained using the MongoDB Spark Connector on Databricks). It then waits for the model to respond with a calculated premium based on the miles driven by a given customer in a month. Then the scheduled trigger updates the ‘customerPolicy’ collection, to append a new monthly premium calculation as a new subdocument within the ‘monthlyPremium’ array. You can then visualize your newly calculated usage-based premiums with an Atlas Chart!
In addition to the MongoDB Platform Features listed above, this section utilizes the following:
Go hands on
Automated digital underwriting is the future of insurance. In this blog, we introduced how you can build a sample usage-based insurance data model with MongoDB and Databricks. If you want to see how quickly you can build a usage-based insurance model, check out our GitHub repository and dive right in!
Learn more about MongoDB and Insurance.