We recently introduced streamlined data sources in Atlas Charts, which eliminates the manual steps involved with adding data sources into Charts. With MongoDB Atlas project data automatically available in Charts, your visualization workflow can become quicker and simpler than ever.
With this feature, Atlas Charts users can now visualize two new sources of data: Atlas Flex tier clusters and Atlas cluster data that’s been archived using MongoDB Atlas Online Archive.
For those unfamiliar with these data sources, here’s a quick summary:
An Atlas Flex tier clusters is an Atlas deployment model that lets you seamlessly scale usage based on workload demand and ensures you are only charged for resources you need.
Online Archive enables automated data tiering of Atlas data, helping you scale your storage and optimize costs while keeping data accessible.
Use cases
These data sources serve two distinct use cases, based on your needs. So, whether you are trying to eliminate upfront resource provisioning using a serverless instance or creating archives of your high-volume workloads, such as time-series or log data to reduce costs with Online Archive, Charts makes these sources natively available for visualization with zero ETL, just as it always has with your other Atlas clusters.
To learn how easy it is to visualize these new data sources, let’s create a Flex tier cluster called “ServerlessInstance0” and separately activate Online Archive on a database called “Cluster0” that will run daily in Atlas
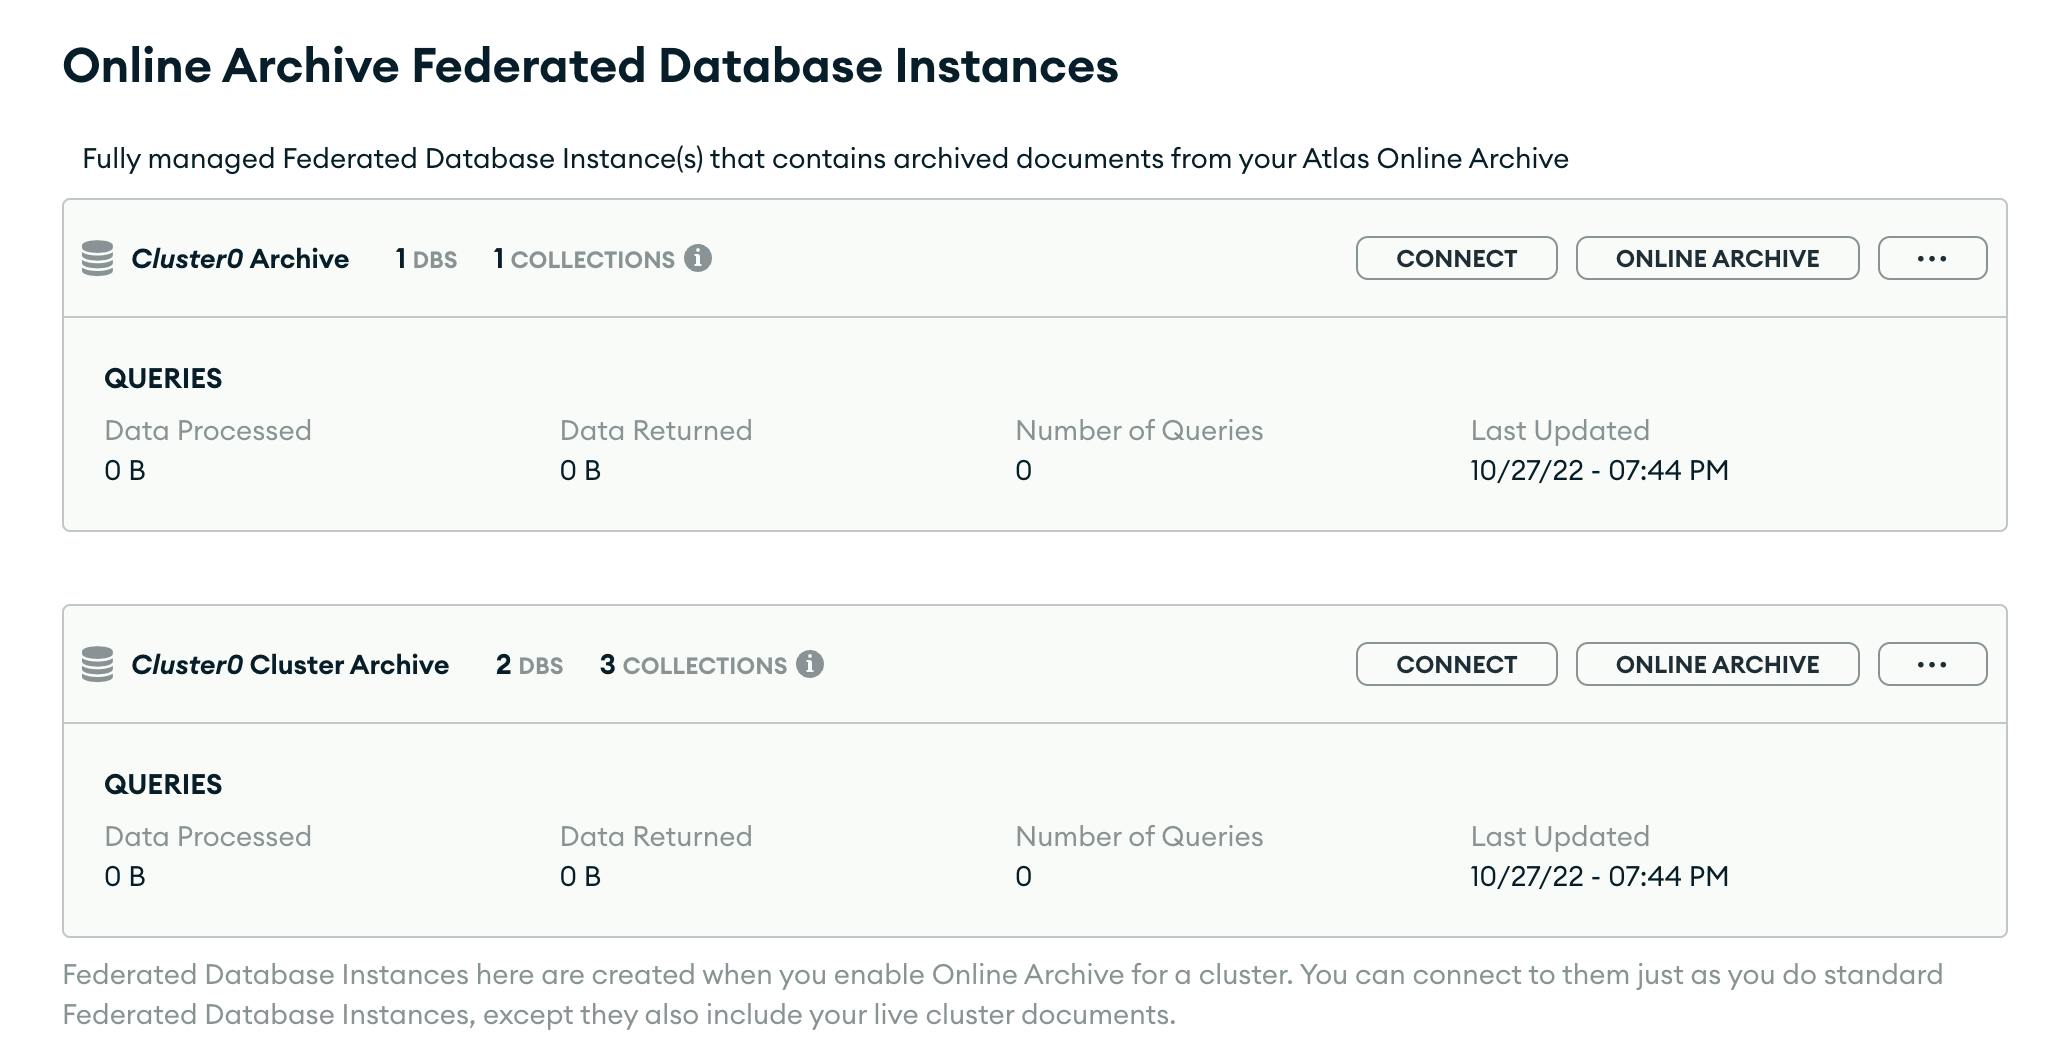
When setting up an Online Archive, Atlas creates two instances of your data (Figure 1). One instance includes only your archived data. The second instance contains your archive data and your live cluster data. This setup gives you additional flexibility to query data as your use case demands.
Moving on to the Data Sources page in Charts, all of the data sources are shown, including Atlas Flex tier clusters and Atlas cluster data archived in Online Archive, neatly categorized based on the instance type and ready for use in charts and dashboards. (Note that project owners maintain full control of these data sources.) For more details about connecting and disconnecting data sources, review our documentation.
With these additions, Charts now supports all the cluster configurations you can create in Atlas, and we are excited to see how you achieve your visualization goals using these new data sources.
New to Atlas Charts? Get started today by logging into or signing up for MongoDB Atlas, deploying or selecting a cluster, and activating Charts for free.