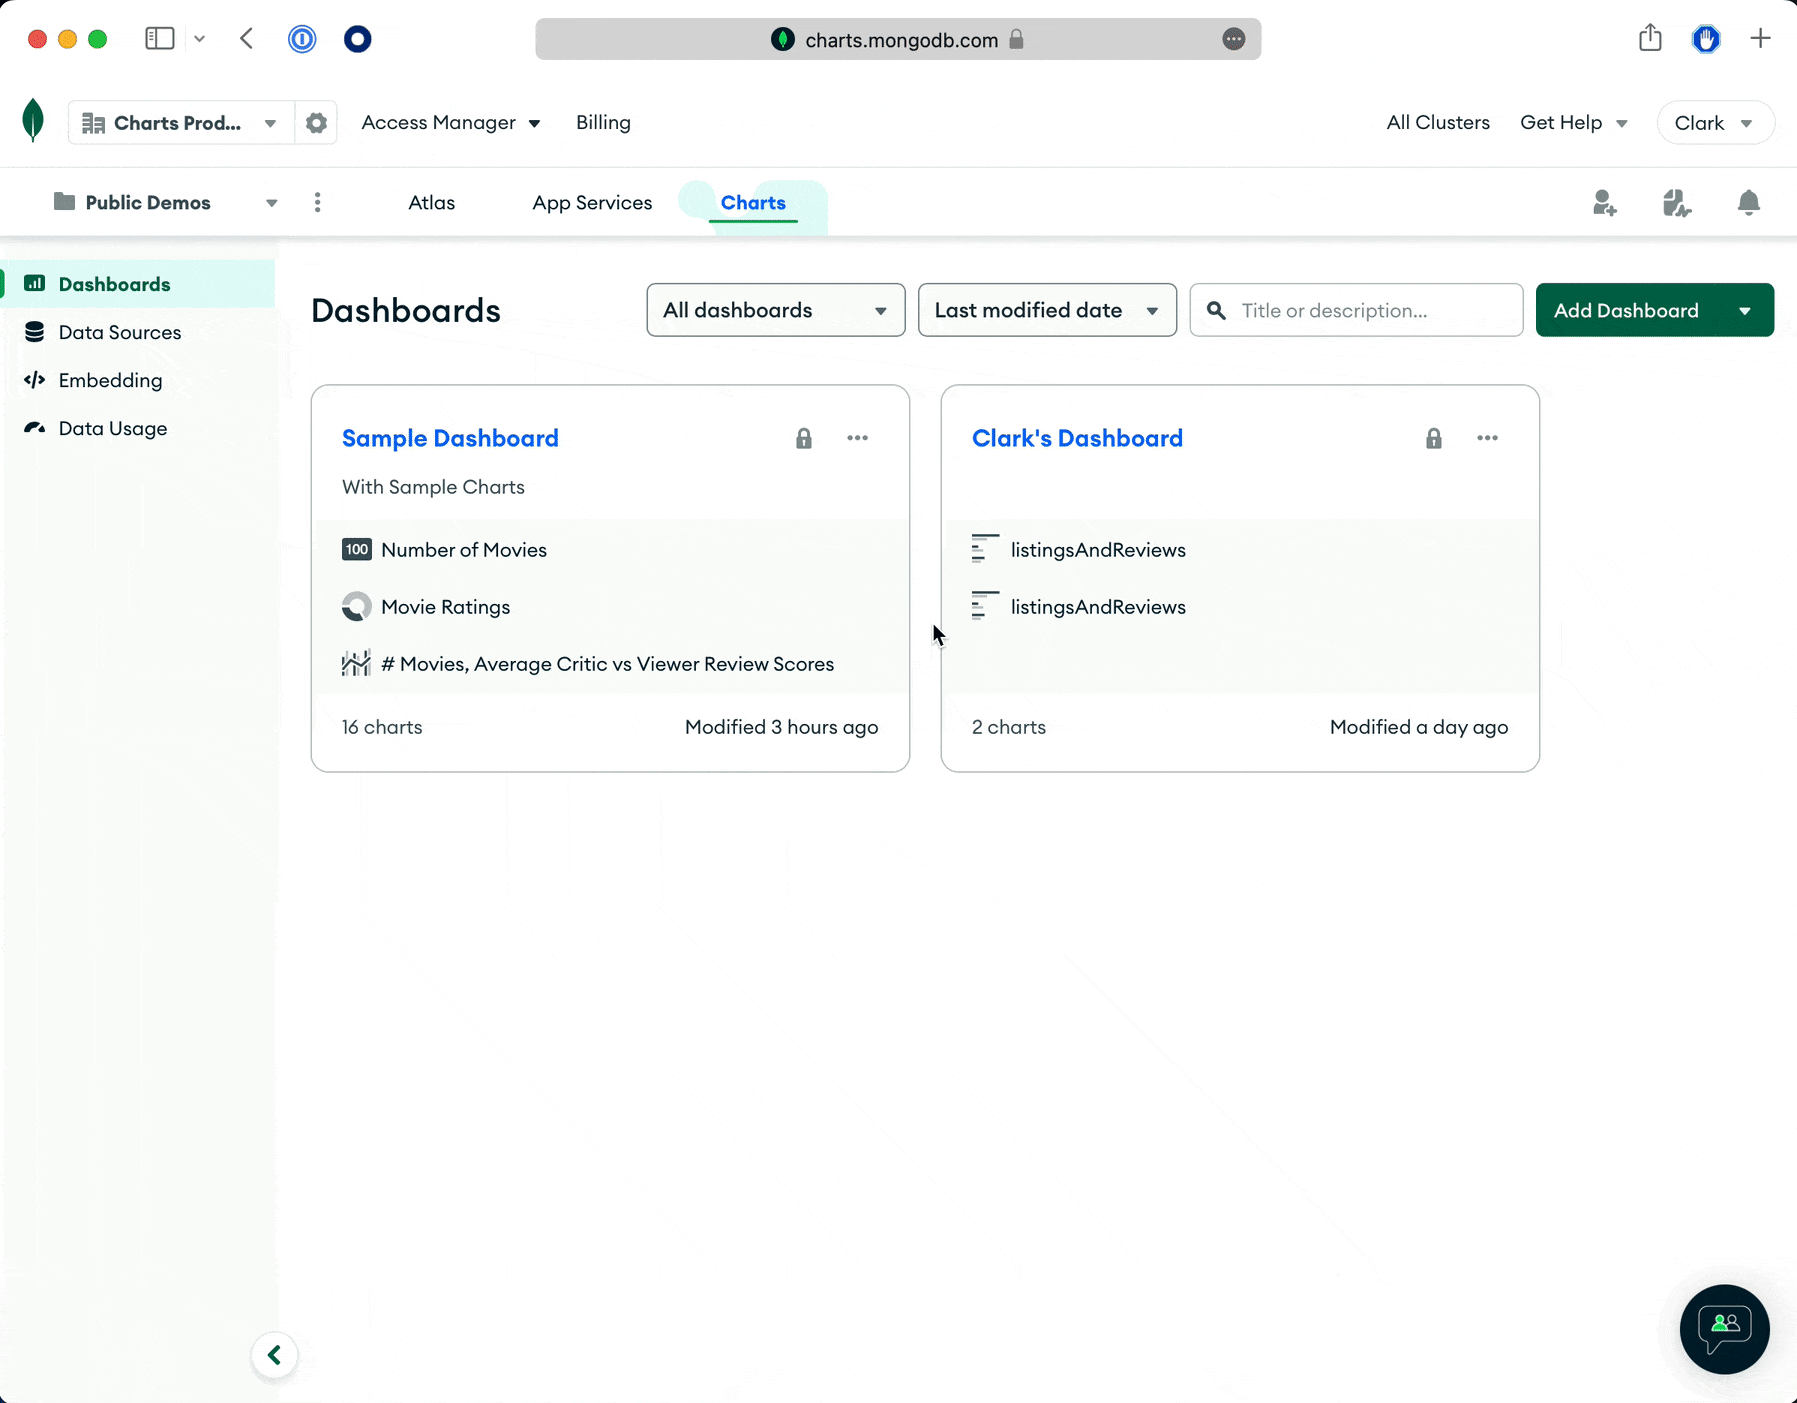
We’re excited to announce a major improvement to managing data sources in MongoDB Atlas Charts: Atlas data is now available for visualization automatically, with zero setup required.
Every visualization relies on an underlying data source. In the past, Charts made adding Atlas data as a source fairly straightforward, but teams still needed to manually choose clusters and collections from which to power their dashboards.
Streamlined data sources, however, eliminates the manual steps required to add data sources into Charts. This feature further optimizes your data visualization workflow by automatically making clusters, serverless instances, and federated database instances in your project available as data sources within Charts.
For example, if you start up a new cluster or collection and want to create a visual quickly, you can simply go into one of your dashboards and start building a chart immediately.
Check out streamlined data sources in action:
Maintain full control of your data
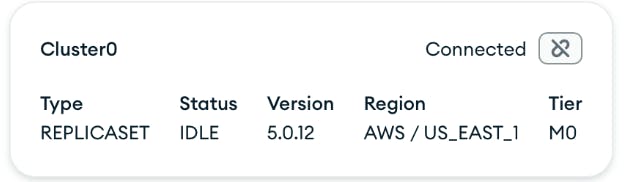
Although all project data will be available automatically to project members by default, we know how important it is to be able to control what data can be used by your team. For example, you may have sensitive customer data or company financials in a cluster.
Project owners maintain full control over limiting access to data like this when needed. As shown in the following image, with a few clicks, you can select any cluster or collection, confirm whether or not any charts are using a data source, and disconnect when ready.
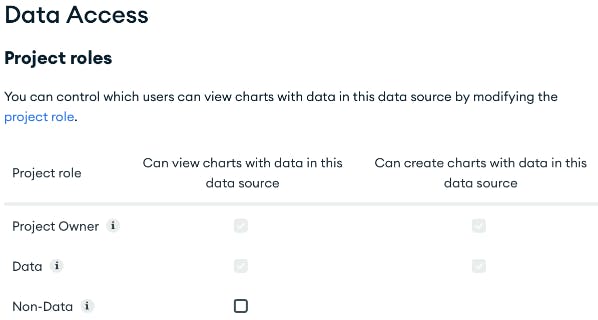
If you have collections that you want some of your team to access but not others, this can be easily achieved under Data Access in collection settings as seen in the following image.
With every release, our goal is to make visualizing Atlas data more frictionless and powerful. The Streamlined data sources feature helps us take a big step in this direction.
Building data visualizations just got even easier with Atlas Charts. Give it a try today!
New to Atlas Charts? Get started today by logging into or signing up for MongoDB Atlas, deploying or selecting a cluster, and activating Charts for free.