Why is $facet so Slow?

I am implementing a paginated search in my order collection. My goal is to display orders in pages of 10 items, and to ensure that pagination works correctly, I need to know how many records match the applied filters. To optimize the number of database queries, I want to perform a single query that retrieves the 10 items on the current page and, at the same time, provides the total number of orders matching the filter, allowing me to calculate the total number of pages to display.

The initial implementation consists of performing two separate queries: one to get the total number of records and another to fetch the data for the desired page. Below are examples of these two queries:

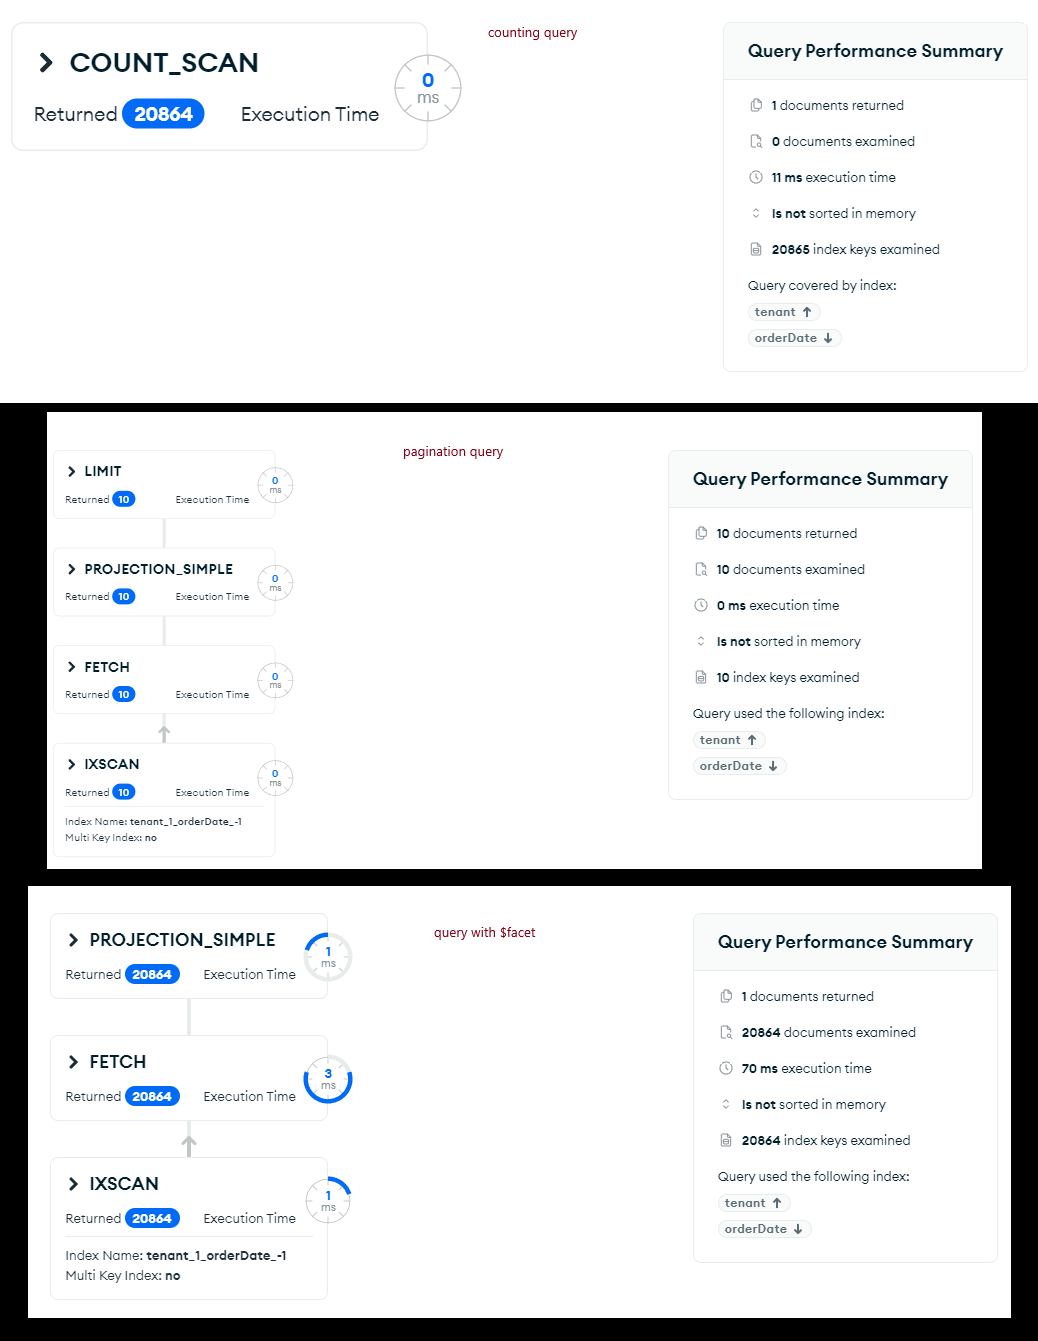
  1. Query to get the total number of records:
[
  {
    $match: {
      tenant: "rosaazul",
      orderDate: {
        $lte: new Date("2024-09-19T23:59:59.999Z"),
        $gte: new Date("2024-09-01T00:00:00.000Z")
      }
    }
  },
  {
    $count: "total"
  }
]
  1. Query to get the data for the page:
[
  {
    $match: {
      tenant: "rosaazul",
      orderDate: {
        $lte: new Date("2024-09-19T23:59:59.999Z"),
        $gte: new Date("2024-09-01T00:00:00.000Z")
      }
    }
  },
  {
    $sort: {
      orderDate: -1
    }
  },
  {
    $skip: 0
  },
  {
    $limit: 10
  },
  {
    $project: {
      _id: 1,
      number: 1,
      orderDate: 1,
      status: 1,
      substatus: 1
    }
  }
]

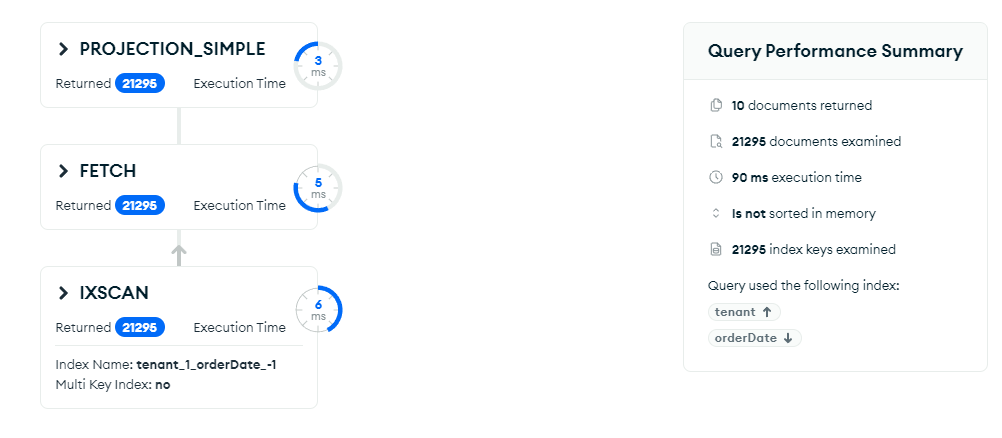
Here is an example of an implementation using the $facet stage in a single query to retrieve both the total number of records and the page data:

[
  {
    $match: {
      tenant: "rosaazul",
      orderDate: {
        $lte: new Date("2024-09-19T23:59:59.999Z"),
        $gte: new Date("2024-09-01T00:00:00.000Z")
      }
    }
  },
  {
    $facet: {
      total: [{ $count: "total" }],
      pages: [
        {
          $sort: {
            orderDate: -1
          }
        },
        {
          $skip: 0
        },
        {
          $limit: 10
        },
        {
          $project: {
            _id: 1,
            number: 1,
            orderDate: 1,
            status: 1,
            substatus: 1
          }
        }
      ]
    }
  }
]

My question is: Why, when I execute the queries in two steps, do I get the page in 0ms and the count in 47ms, but when I use a single query with $facet, it takes at least 72ms?

Can we see the code where you time the above?

What languages are you using?

I would be very surprised that you get 10 pages in 0ms while you get the count in 47ms. One misconception is that you get a cursor out of an aggregation, if you do not consume the cursor then you are timing the cursor setup rather than the transfer of the documents.

1 Like

I timed it with Mongo Compass.

I am considering the execution time accounted for by Mongo Compass itself.

I really do not know why the explain plan seems to indicate (for count_scan) 0ms (number on the left) while Compass indicates 11ms.

The issue is that without the $facet the FETCH only process 10 documents while all documents are FETCHed for $facet.

Try to move $sort right after the $match.

One hack you could try to use $unionWith something like:

This might avoid FETCH of all documents.

1 Like

When I refer to execution time, I am pointing to the value listed on the right of each benchmark. I remain very bothered by the fact that $facet significantly degrades performance. However, when testing the approach you suggested, I experienced real performance improvements, not only in the MongoDB Compass benchmark, but also easily noticeable gains in response time to my client.

Do you have any idea why $facet caused this degradation?

1 Like

The culprit is that without the $facet, only 10 documents are FETCHed.

With the $facet all matching documents 20464 are FETCHed even if none are required for the count: facet and only the 10 returned needs to be FETCHed for the page: facet.

The exact reasons why all matching documents are FETCHed with $facet is above my pay grade. But it looks like the stage is doing some kind of Eager Fetching rather than Lazy Fetching. It is probably hard to analyze all the facets to determine which documents to fetch or not. So in this specific $facet, pre-Fetching is detrimental. Which is probably not the case for any more complex $facet. The pre-fetch probably occurs to prevent fetching the same document over and over again which would be the case when each facet is performed in parallel.

With the $unionWidth, no documents are fetched for the count. And then the $unionWith pipeline follows the normal path of execution and only fetch 10 documents. This way it simply bypass an optimization that does not work for a specific case.

If my hack works, and it seems that it does, then I am happy.

1 Like

You can be happy! Your hack worked and brought me real gains. I tried another alternative, which also failed: adding windowed counting, similar to what I usually do in SQL.

[
  {
    $match: {
      tenant: "rosaazul",
      orderDate: {
        $lte: new Date(
          "2024-09-19T23:59:59.999Z"
        ),
        $gte: new Date("2024-09-01T00:00:00.000Z")
      }
    }
  },
  {
    $setWindowFields: {
      sortBy: {
        orderDate: -1
      },
      output: {
        totalCount: {
          $count: {}
        }
      }
    }
  },
  {
    $sort: {
      orderDate: -1
    }
  },
  {
    $skip: 0
  },
  {
    $limit: 10
  },
  {
    $project: {
      _id: 1,
      number: 1,
      orderDate: 1,
      status: 1,
      substatus: 1,
      totalCount: 1
    }
  }
]

1 Like

This topic was automatically closed 5 days after the last reply. New replies are no longer allowed.