I am not sure what are the commands execute continuously 20 to 50 commands at a time,
Can anyone please guide or share some reference documents for this?
Thanks.
I am not sure what are the commands execute continuously 20 to 50 commands at a time,
Can anyone please guide or share some reference documents for this?
Thanks.
Not of much help but just some findings…
The mongostat docs (probably source of the data) aren’t really helpful. So I guess it could be updated too.
I thought it may have to do with the replica sets but after testing on my own test-cluster that number is just 0.
Hi @turivishal,
Could you provide further context regarding your query about the commands? e.g. Is there a performance issue you’re experiencing that needs investigation?
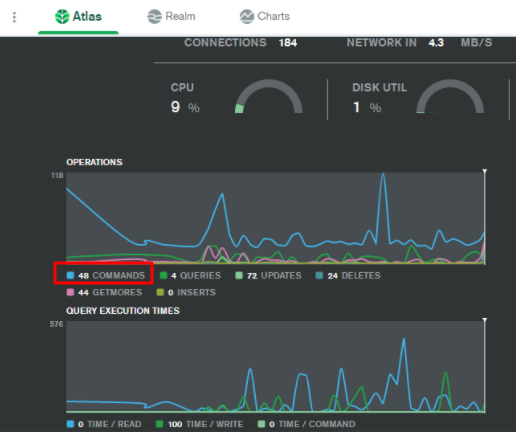
The values shown in the Operations tab in the Real-Time Performance Panel displays the number of the specified operations (commands, queries, etc.) as reported by mongostat .
The command count in Atlas’s Real-Time Performance Panel includes some of the commands such listed below which are used for administrative / monitoring purposes:
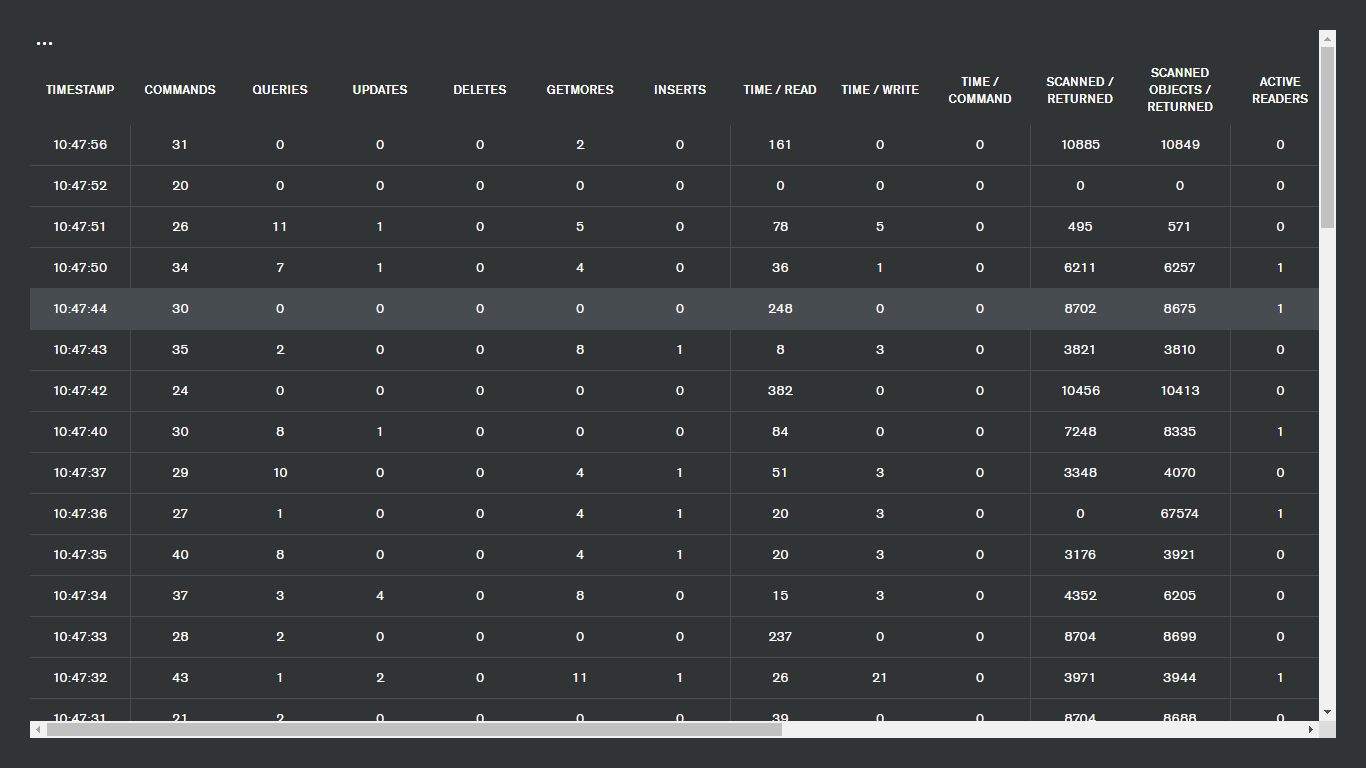
Based off your second screenshot as well, I presume the command count being seen is inclusive of both internal commands as well as commands from application(s) connecting to the cluster.
Regards,
Jason
Thank you for your reply,
VERSION: 4.4.10
REGION: AWS / Mumbai (ap-south-1)
CLUSTER TIER: M30 (General)
TYPE: Replica Set - 3 nodes
BACKUPS: Active
LINKED REALM APP: None Linked
BI CONNECTOR: Disabled
ONLINE ARCHIVE: None
I am not sure but on average it executes 30+ commands in real-time, so I asked if it is usual behavior and how to investigate if is there any issue.
Thanks for the reference will review it.
The log file is not available for small clusters, but it would be for M30. There, you could compare the number of commands emitted, to the table.
Apparently, but I have not done this, you need to run:
curl --user '{PUBLIC-KEY}:{PRIVATE-KEY}' --digest \
 --header 'Accept: application/gzip' \
 --request GET "https://cloud.mongodb.com/api/atlas/v1.0/groups/{GROUP-ID}/clusters/{HOSTNAME}/logs/mongodb.gz" \
 --output "mongodb.gz"
Also, this site has some information on how to download logs (commands should be logged).
Hi @turivishal,
if it is usual behavior and how to investigate if is there any issue.
For comparison, a test M30 cluster I have with no external workload to the cluster averages between approximately 20 to 30 commands per second. The amount in your screenshot is slightly higher but I am assuming this isn’t an idle cluster so I don’t believe it’s unusual.
However, looking into the command count by itself may not provide much insight to whether and issue is present or not. The How to Monitor MongoDB page may be useful as it provides some further details on some cluster metrics if you believe there is an issue occurring to help narrow down the cause.
Hope this helps.
Best Regards,
Jason
Is there a way to put my m10 cluster on pause during days when it is not being used?