hey all, I’m really trying very hard to understand how this works. But I’m hitting a wall every time.
I have a collection of documents that has analytics records of, here’s an example of 1 record: { if, commandRequested, dateRequested (in String) }
I’m trying to get an average of Mon, Tue, Wed, Thu, Fri, Sat and Sun in a Chart.
But so far the chart types i’ve tried is giving me a Total count on those days.
How does this even work?
First of all, if you want to do any kind of date arithmetic or processing, you’ll need your dates to be proper Date types, not strings. You can use Charts to convert types, although it will always be slower to convert on the fly than it would if you stored them as the correct type in the first place.
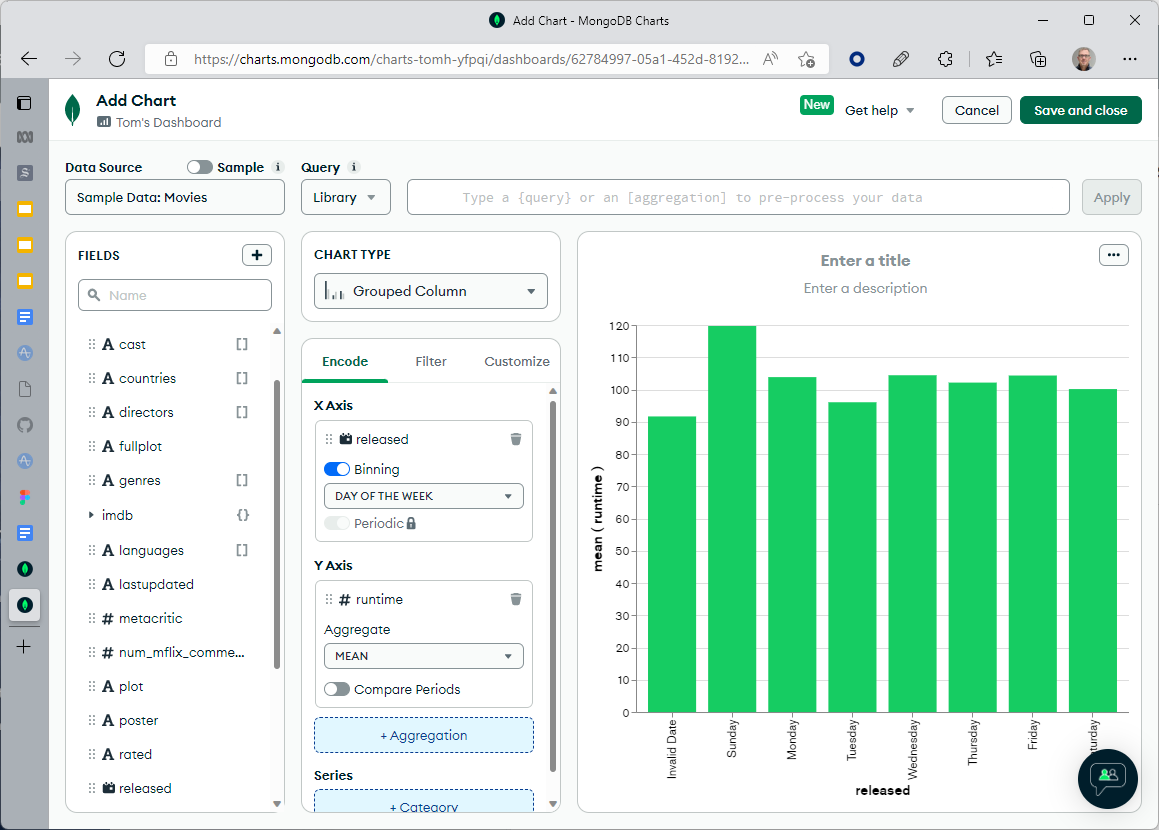
Once you have your datey dates, you can create the chart you want by:
Encoding the date field on the X axis, enabling Binning and choosing Day of the Week
Encoding the field you want to average on the Y axis, and choosing the Mean aggregate.
Hello @tomhollander, I was happy for awhile when I tot it was that easy.
But I think there’s some difference in the data we have.
My data isn’t aggregated of runtimes per record. But instead, each record is a frequency (record) by itself.
More like…
Week 1
Function A | Monday
Function B | Tuesday
Function A | Tuesday
Function A | Wednesday
Function B | Tuesday
Function A | Tuesday
Week 2
Function B | Monday
Function B | Tuesday
Function B | Tuesday
Function A | Wednesday
Function A | Tuesday
Function A | Tuesday
Now, I want it to chart it like an average because I would like to know if my users interact with which function more often on Monday or Tuesday or whichever day it is.
Here’s a sample document, i have 6,000 of records.
Commands differs based on what commands are being called by the user.
But i just want to know how active are users using my service for each day of the week.
I have a chart right now that just deals with an aggregated counts of all these function calls, but i wan to know the average amount so that i can decipher which day of the week is most active.
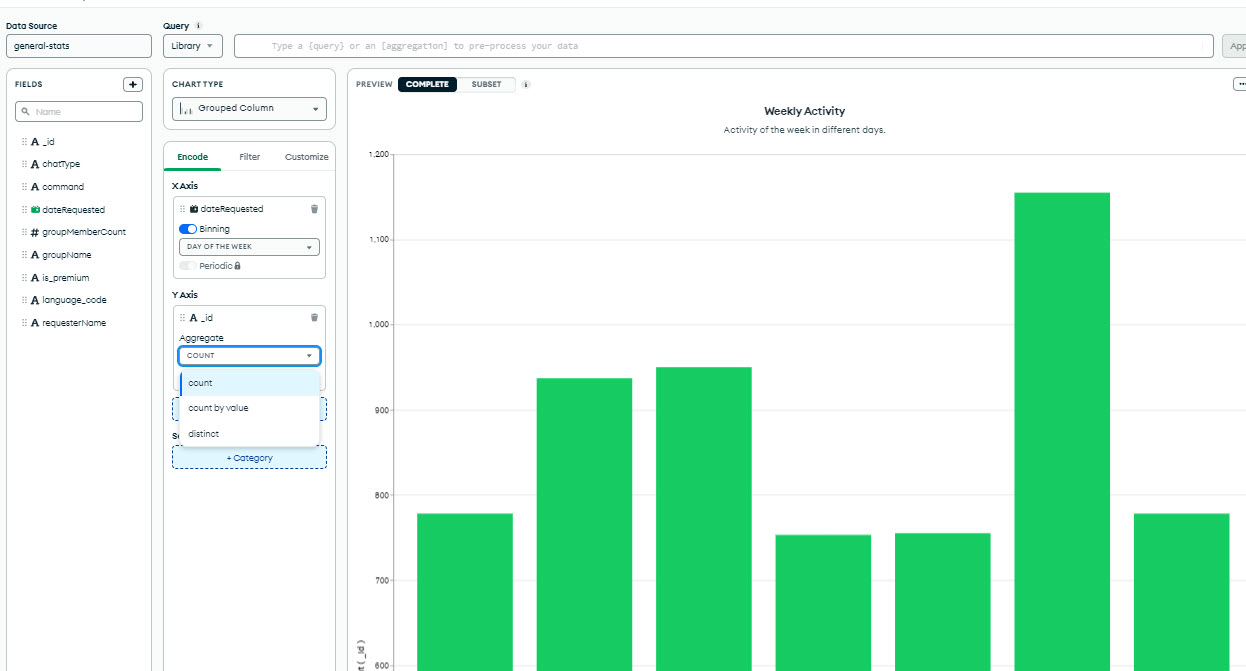
OK - I’m not sure why you can’t use my approach then? Put dateRequested (as a date) in your X axis and bin by day of the week. Put mean ( _id ) in the Y axis. Maybe put command in the Series channel if you want to break it down that way?
Sorryv my bad, you can’t calculate the average of _id because it’s a string not a number. What exactly do you want to calculate the average of? If you use count(_id) it will show the total number of events per day which may be useful for you?