Hi mongo geeks,
I hope you are doing well
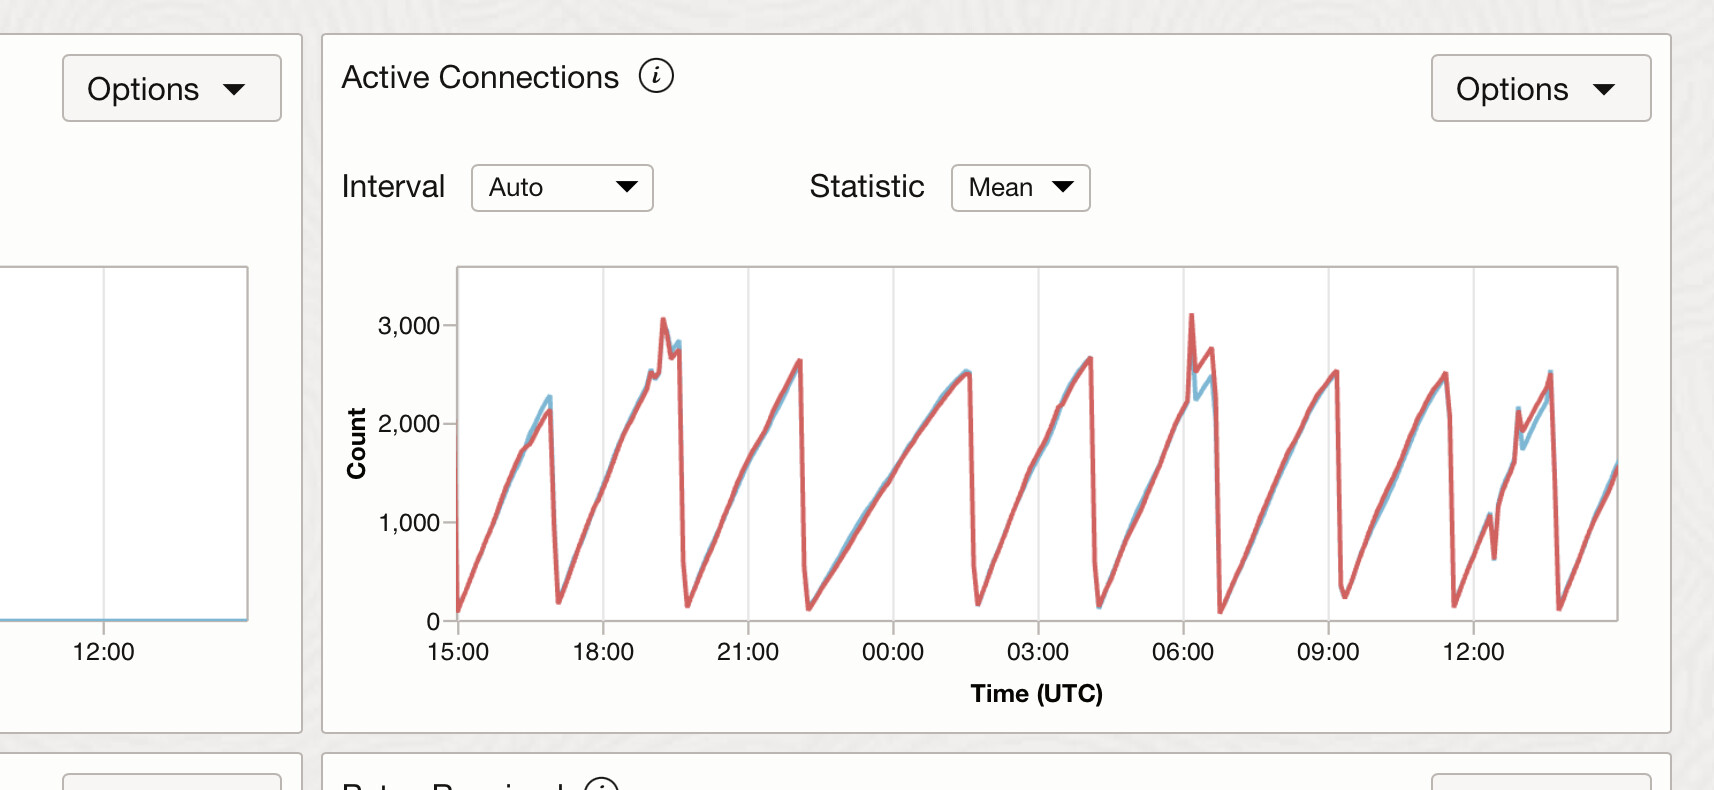
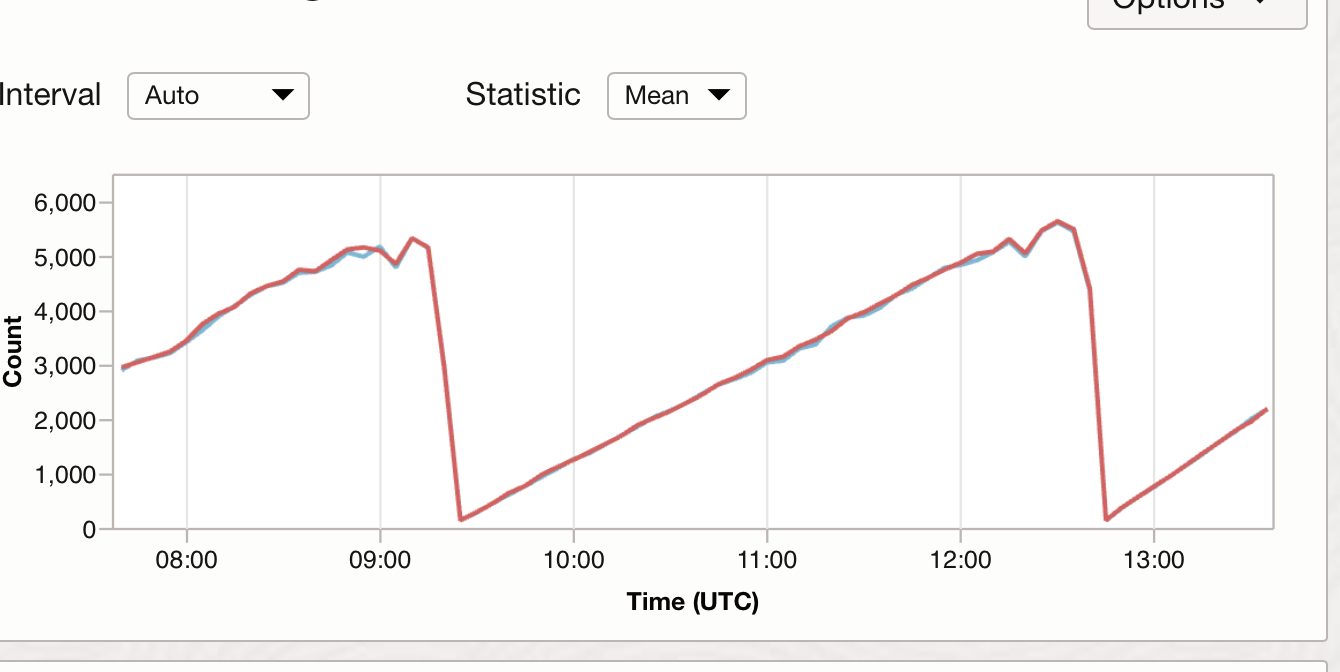
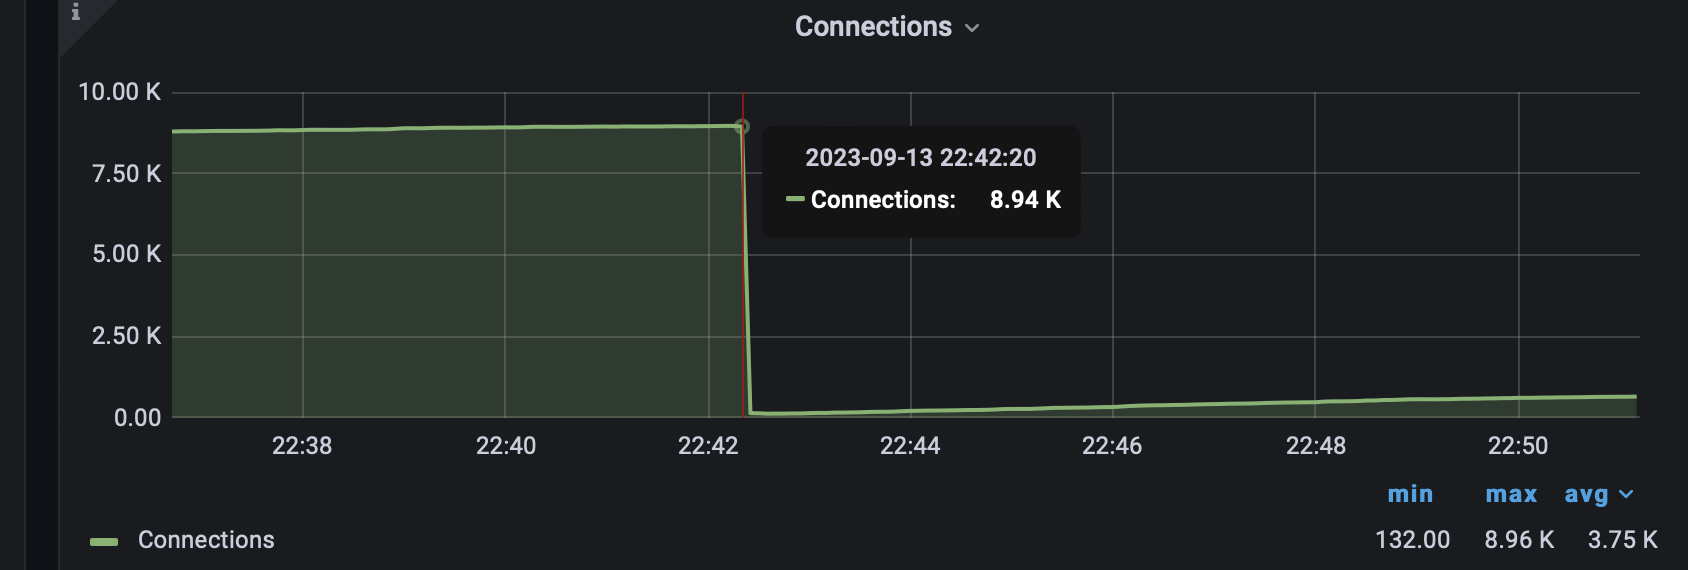
I have storage issue where mongodb opens a lot of connections then they all gets dropped suddenly and I found this log lines,
{"t":{"$date":"2023-09-12T19:16:41.306+00:00"},"s":"I",  "c":"CONNPOOL", "id":22572,   "ctx":"MirrorMaestro","msg":"Dropping all pooled connections","attr":{"hostAndPort":"10.10.0.175:27017","error":"ConnectionPoolExpired: Pool for 10.10.0.175:27017 has expired."}}
{"t":{"$date":"2023-09-12T19:16:44.242+00:00"},"s":"I",  "c":"CONNPOOL", "id":22572,   "ctx":"MirrorMaestro","msg":"Dropping all pooled connections","attr":
PS. I’m running mongo 4.4
seeking your usual support
I see similar question on stackoverflow, but no answers.
You can try tuning connection pool settings like min or max value. This might also be an internal logic in mongoDb.
After all, Mongodb drivers will take a good care of connection pooling for most use cases by default.
I personally wouldn’t spend too much time on this, if i 'm not noticing any other issues from application level (e.g. high latency on requests).
anyone knows what are the tcp parameters for the host os that might affect the number of the connections ?
I mean we might be hitting the limit of the TCP/IP connections
thanks @Kobe_W any idea which config could be related to this ?
as I know the net.maxIncomingConnections to limited to the os limits which in my case are :
core file size          (blocks, -c) unlimited
data seg size           (kbytes, -d) unlimited
scheduling priority             (-e) 0
file size               (blocks, -f) unlimited
pending signals                 (-i) 126920
max locked memory       (kbytes, -l) 64
max memory size         (kbytes, -m) unlimited
open files                      (-n) 1048576
pipe size            (512 bytes, -p) 8
POSIX message queues     (bytes, -q) 819200
real-time priority              (-r) 0
stack size              (kbytes, -s) 8192
cpu time               (seconds, -t) unlimited
max user processes              (-u) 32768
virtual memory          (kbytes, -v) unlimited
file locks                      (-x) unlimited
if your deployment is big or you have many connections from those drivers, 837k might be fine. It only means at the time you run that query, those connections are idle.
did you try setting a max connection number for the pools from driver side?
try using a very small number and then see if anything changes on the server side numbers.
i have no experience with atlas, so i don’t know if those numbers are aggregated from all nodes or not.