we have mongodb 4.2, 1 master and 2 slave replicaset. And application reads from secondaries.
when i reach high read qps (15k read qps while using 2 secondaries and 9k when using 1 secondary) with small number of writes (~500 qps) the read latencies shoot up.
Here are some other details
- CPU utilisation 75% idle
- load number 0.4 par cpu
- spike in cpu usage, interrupts, free memory and created process when the failure occurs.
- no major drop in concurrency ticket availability
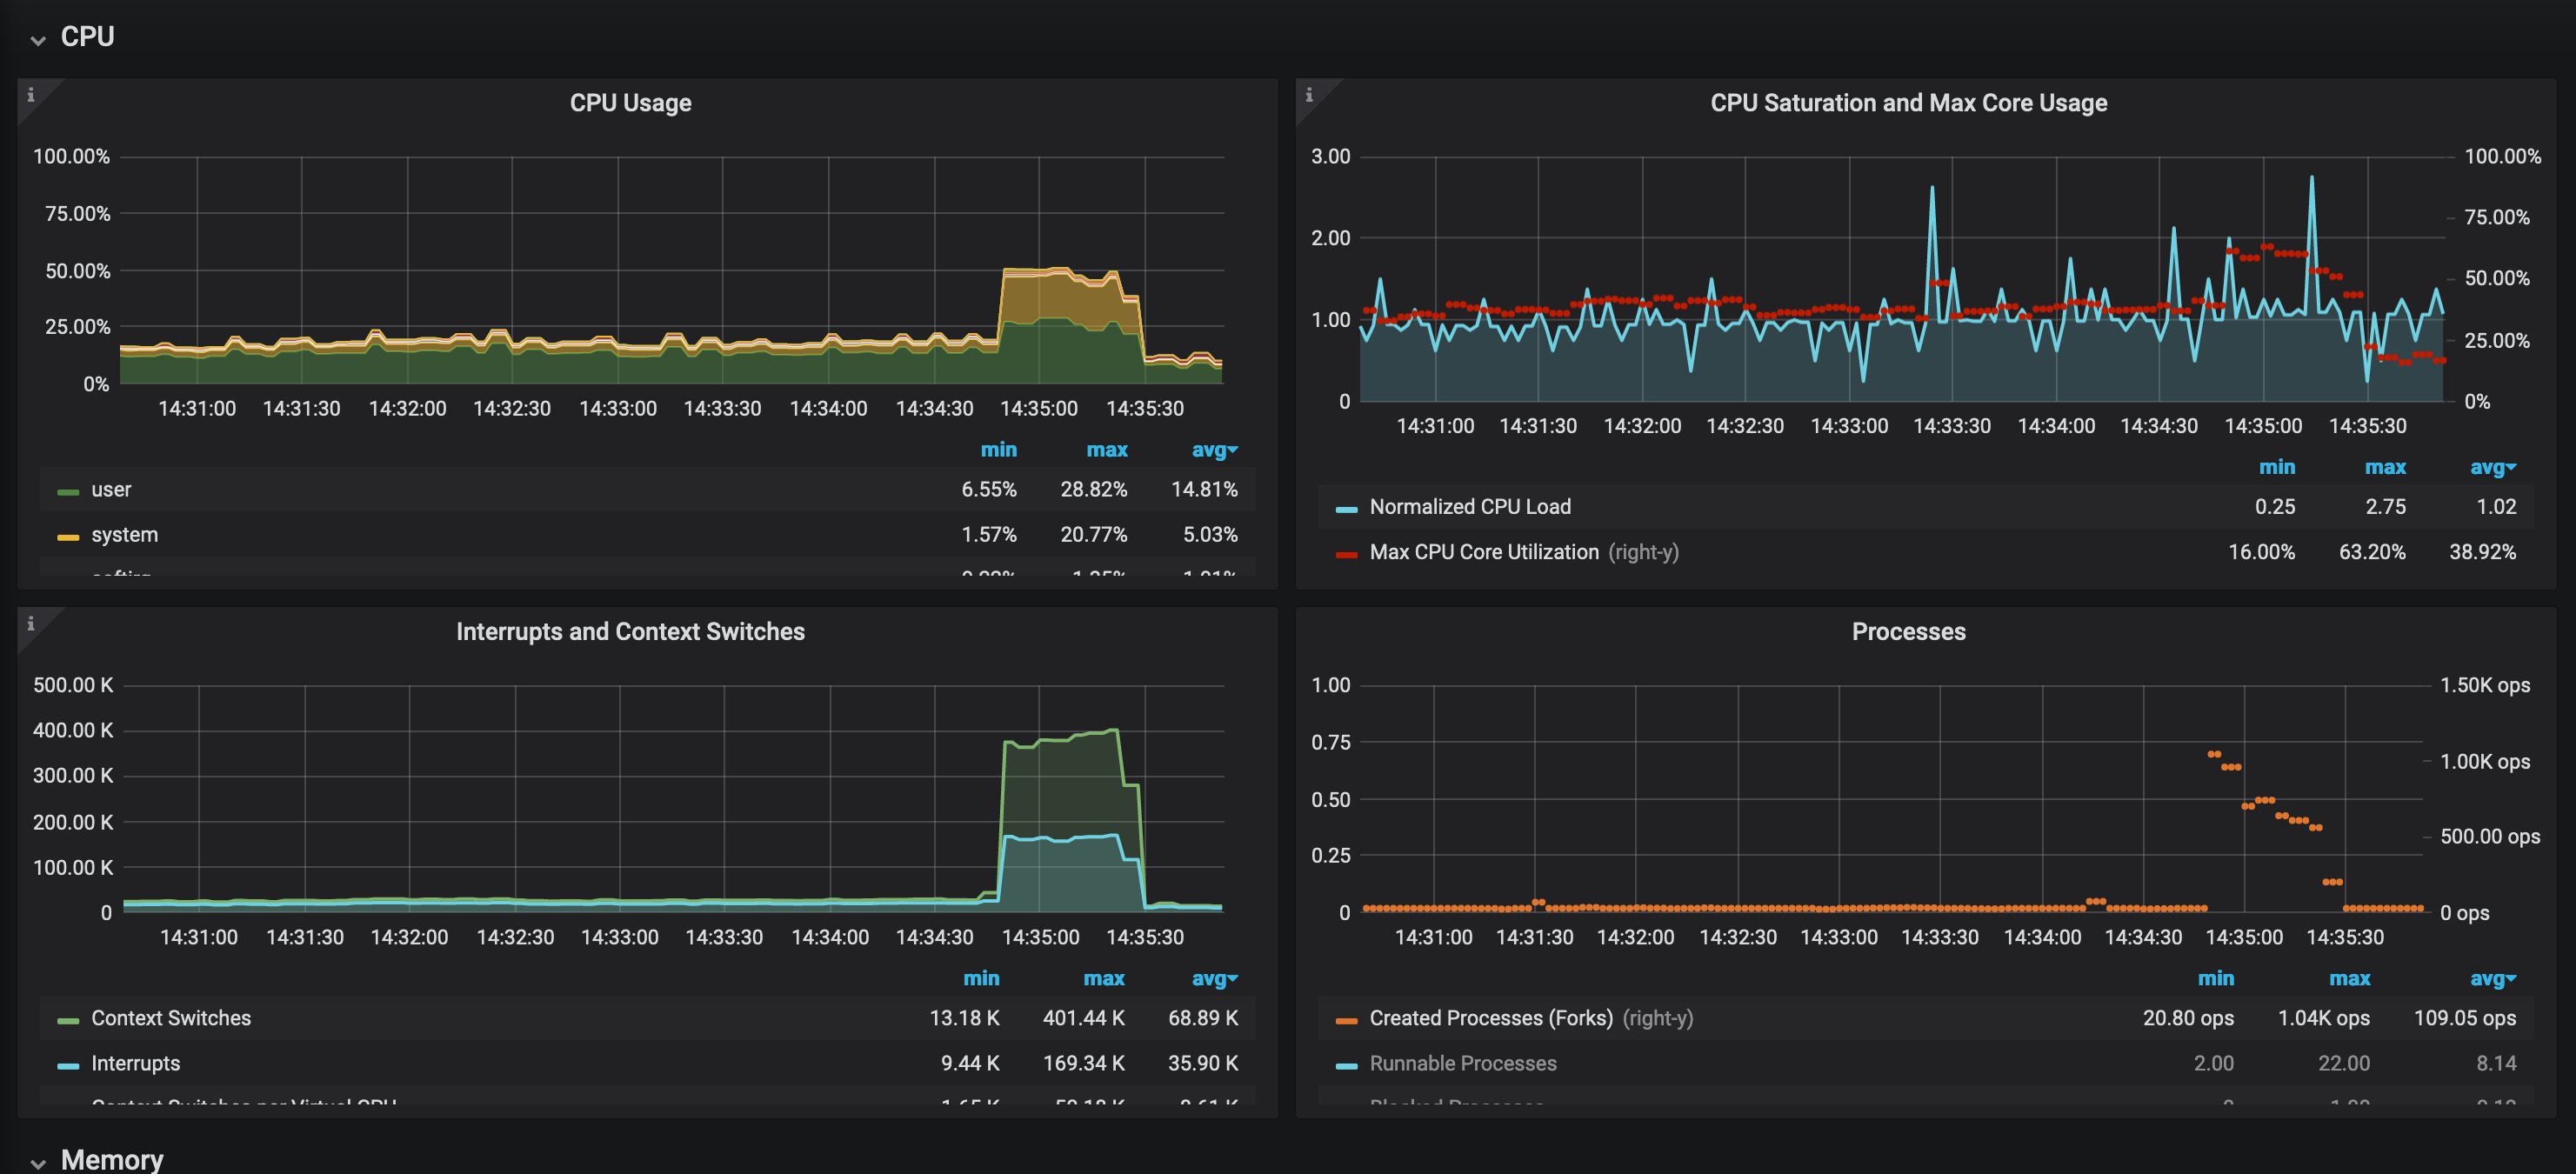
i have uploaded rest related metric here
The reads are not random hence i don’t think it is a memory pressure issue (read iops are also not much supplement this argument).
Primarily it seems like mongo application limitation but i am not sure how it can be concluded.
can someone give pointers about how it can be debugged next?
- when does mongodb create new processes?
- what explains high number of interrupts and context swtiches?
- why would free memory spike? when box is obviously under high memory pressure.
This is not an intermittant issue for sure, since i was consistently able to reproduce this.