Hi
Our issue: We are facing a lot of “scanned objects / returned has gone over a 1000” alerts. What we have done so far:
Used the profiler to detect problematic operations and added the relevant indexes. The performance advisor doesn’t give any more indexes to add and we seem to be in a good place with our indexing.
We tried finding things online and investigating further but couldn’t get to something.
Our questions for you:
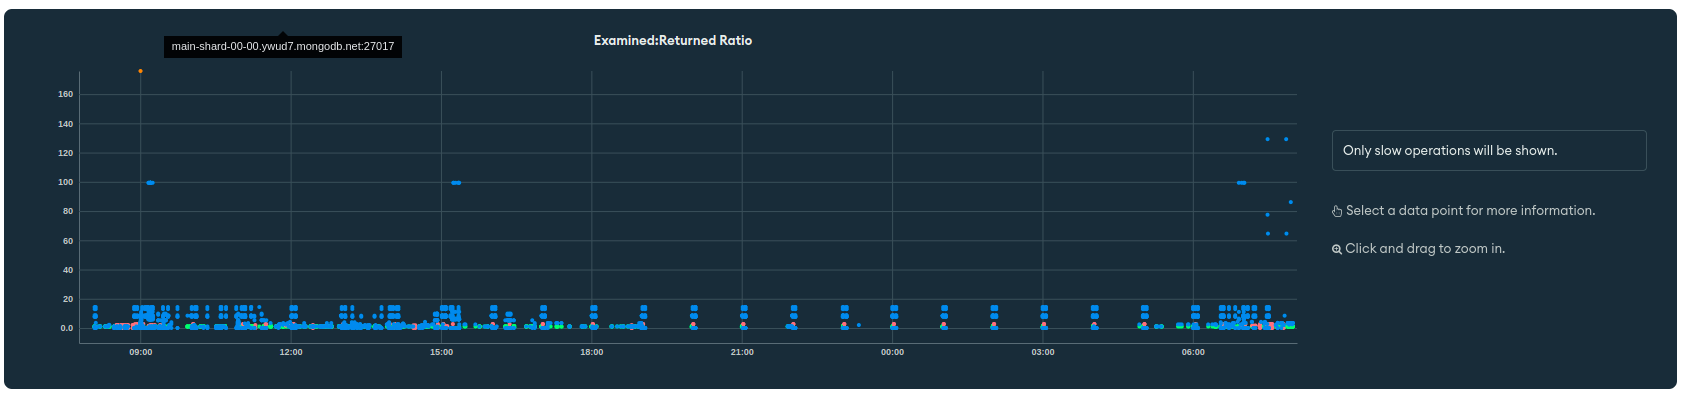
When I look at the monitoring tab I see that for some periods of time our query targeting reaches 8K. But when I go to the profiler I don’t see the queries that caused that in the examined/returned ratio. Can the alert be caused by something else ?
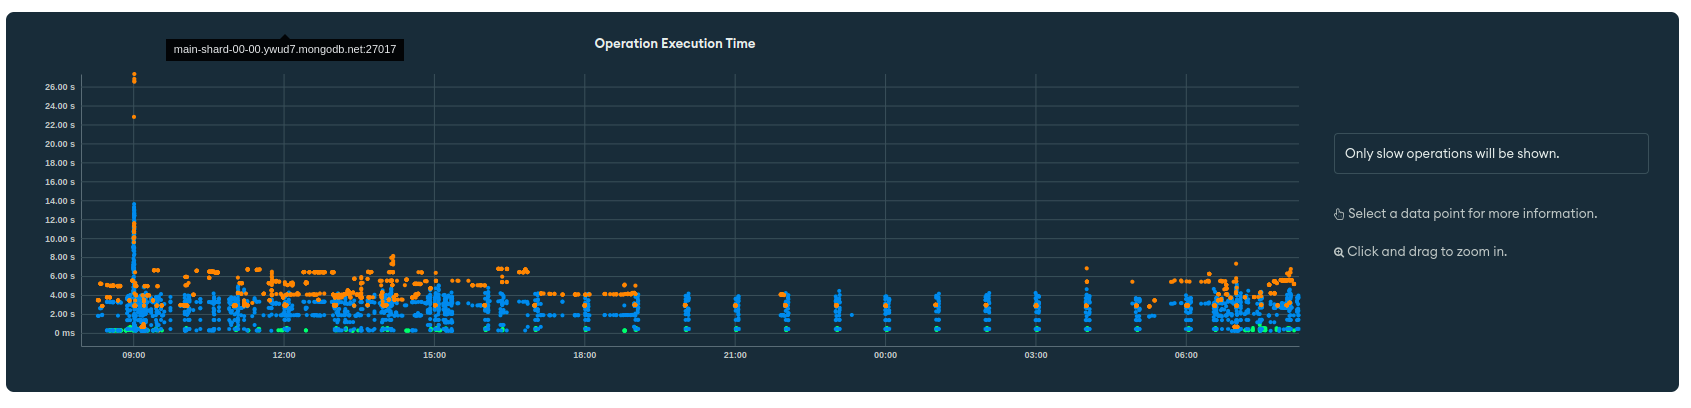
I did notice that for some queries, our execution time is pretty major (aggregations) and reaches 10s+.
Can the alert be caused by slow execution times?
Thanks. We really appreciate your help!
The following alert is caused when you are scanning more documents compared to the number of documents returned by the query, i.e. the query is being executed in an inefficient manner. Typically this happens when the query is not using the right index, or there is no index that can be used to support the query. Please see the query targeting page for more details.
In most cases, this can be solved by creating indexes that can support the query, Indexing Strategies is a great resource for more information on this topic.
Does this mean, 8k is the number of documents getting scanned in order to return one document ? Can you please confirm if my understanding is correct here ?
Most times, slow execution times is a side effect of having an inefficient query, instead of the other way around. So it is entirely possible that the alert was caused by this aggregation being inefficient.
If the 10+s aggregation query is frequently used, could you share the query for the same. Also, can you confirm if the queries are disruptive to their operations.
Please note that we could help with the query questions when supported with example documents, index descriptions etc. However, if you need an in-depth troubleshooting, would recommend you to seek support from Atlas support as they would have moe visibility in the deployment.
Please let us know if you have any further questions.
Thanks for the reply ! We did add a lot of new indexes to improve our query targeting. We managed to make our queries very efficient.
We thought we had this solved and then yesterday we got the alert again. When I go into the query targeting tab I don’t see anything above 1k. (The alert was yesterday at 3pm UTC)
Execution time and query efficiency are not the same: execution time simply measures how long a query took, while efficiency measures how many documents scanned vs. returned.
For example, a query can be efficient (ratio of documents scanned vs. return is 1:1), but if the documents it needs are not in memory, it needs to fetch them from disk. This makes the query slow, even though it’s efficient.
If I understand the graph correctly, there appear to be a pattern of slow queries every hour consistently. Could you confirm if you have some operation running every hour on the database?
If you wish to disable the alert, you can follow the Disable an Alert documentation. However, in saying this, perhaps the Fix Query Issues documentation may be useful to you.