HI!
We have a M30 Cluster in MongoDBAtlas, and from time to time we receive mails about a high CPU consume, like this (note the date and time):
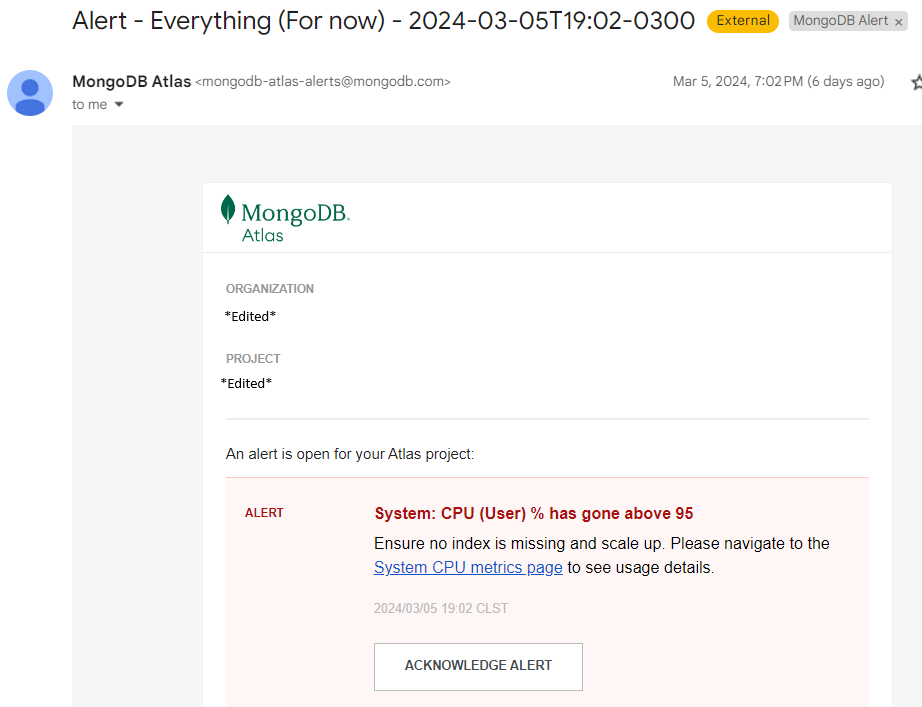
But when we go to the monitoring tool, we don’t see for that date and time the high consume of CPU, instead shows for the normalized use of CPU only 4%.
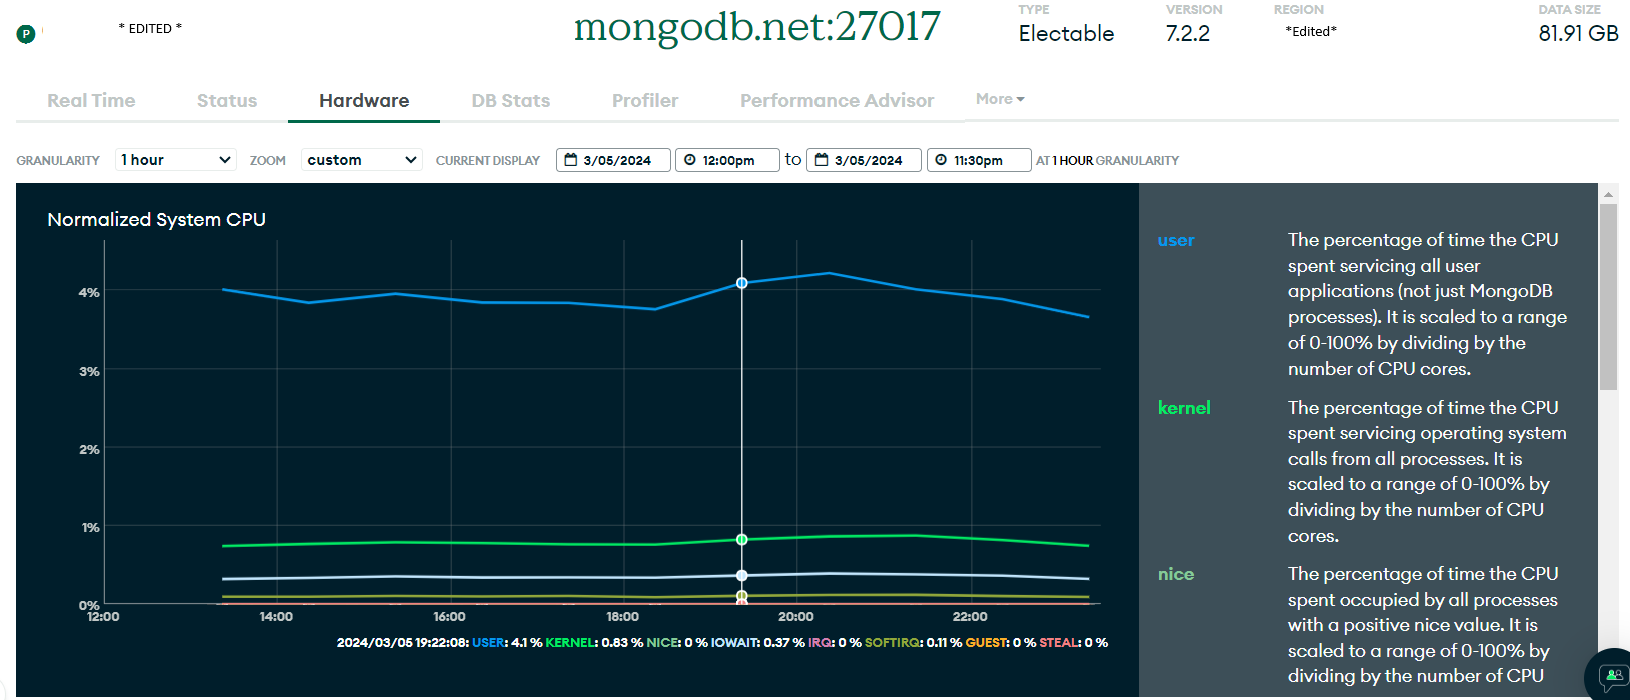
So, the first question is in which monitor system we have to believe or I’m missing something?
The second question is regarding these “empty” spaces in the monitoring tool, like in this image:
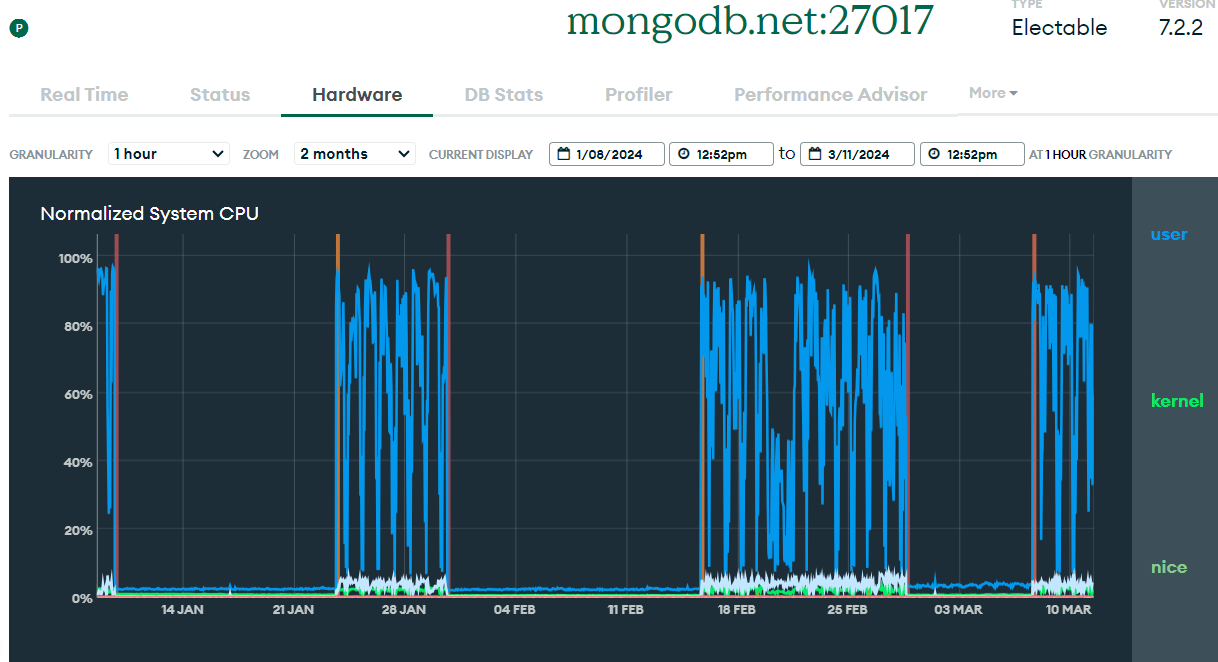
As you can see, there are many days with low or nothing use, but our use of the DB is the same for all days. Then, why is no reflected in the monitoring tool?
And the third question is regarding the cluster sizes. If it possible to upgrade only CPU and not everything else?
Thanks in advance.
Regards,
Víctor Merino