I use Java to create an aggregation pipeline. If I copy/paste that pipeline and run it in Compass, it executes quickly and the explain plan show that it’s using all the indexes I expect. When I run it in Java, it executes extremely slowly, and the query plan shows that it is NOT using the indexes that were used when in Compass. It’s definitely exactly the same pipeline in terms of its text representation, because I just copy/paste that from Java into Compass.
Why might this happen, and what can I do to ‘fix’ it in Java?
I’m running a local community edition v6.06, Compass 1.39.4, and Java sync version 4.10.2.
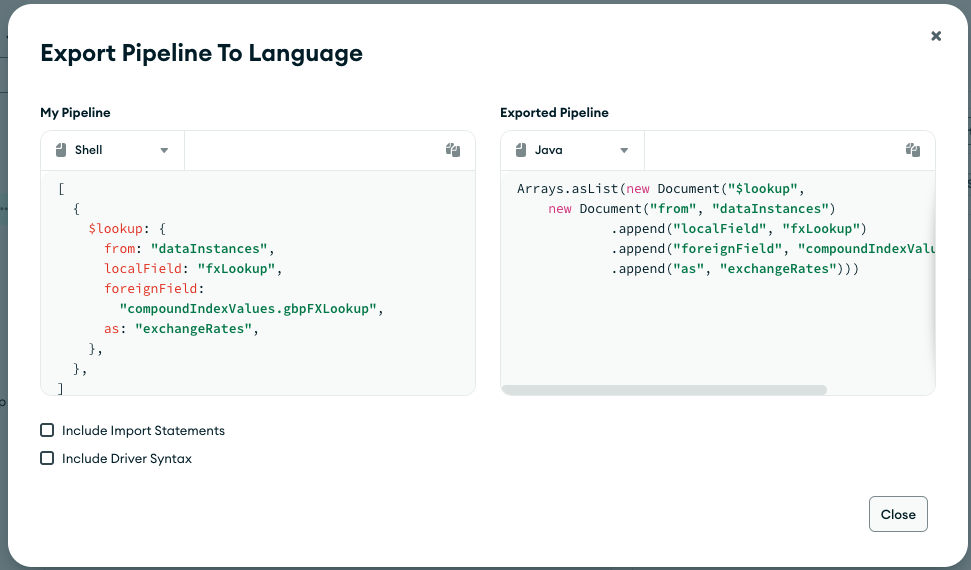
Here’s a snippet of the pipeline that seems to be behaving differently (forgive the field names, it’s all handled by the code and honestly there’s a good reason for it!)
{
    $lookup: {
      from: "dataInstances",
      localField: "fxLookup",
      foreignField:
        "compoundIndexValues.gbpFXLookup",
      as: "exchangeRates",
    },
  }
The explain on Compass shows me this for that bit:
{
      "$lookup": {
        "from": "dataInstances",
        "as": "exchangeRates",
        "localField": "fxLookup",
        "foreignField": "compoundIndexValues.gbpFXLookup"
      },
      "totalDocsExamined": 3631,
      "totalKeysExamined": 3631,
      "collectionScans": 0,
      "indexesUsed": [
        "schemaId_6f527503-ca52-4121-93ef-aa8b40537f1b_concatenatedFieldNames_gbpFXLookup"
      ],
      "nReturned": 4170,
      "executionTimeMillisEstimate": 194
    }
And the same pipeline executed via Java gives this in its explain:
documentAsMap = {LinkedHashMap@8342}  size = 7
 "$lookup" -> {Document@8252}  size = 4
 "totalDocsExamined" -> {Long@8254} 440902440
 "totalKeysExamined" -> {Long@8153} 0
 "collectionScans" -> {Long@8257} 4170
 "indexesUsed" -> {ArrayList@8259}  size = 0
 "nReturned" -> {Long@8261} 4170
 "executionTimeMillisEstimate" -> {Long@8263} 160575
(sorry, it’s just the copy of the debug stuff from IntelliJ, but hopefully you get the drift that it isn’t selecting to use the index)
Note that the ‘from’ collection is the same as the one the pipeline is running against. It has ~100k rows in it, so pretty tiny really. The pipeline IS quite large, with a few unions and projections up top, and 3 $lookups in total. One of those DOES use the index in both scenarios, but the other two don’t.
I can post more stuff but the pipeline is quite big and the field names are so complicated that it makes reading it difficult, so I’m hoping that somebody out there can help me to pin it down.