Problems with using @mongodb-js/charts-embed-dom to embed a chart from MongoDB

METHOD 1

I am trying to embed a chart from MongoDB using the following code, which was adapted from documentation from MongoDB and NPM.

<script src="https://unpkg.com/@mongodb-js/charts-embed-dom"></script>

<script>
  const ChartsEmbedSDK = window.ChartsEmbedSDK;

  const sdk = new ChartsEmbedSDK({
     baseUrl: "https://charts.mongodb.com/charts-webscraping-ciaso-ercot-wnjhz",
     });

  const chart = sdk.createChart({
      chartId: "62d7224c-79ab-41ca-83f6-690f4ab86869", 
     });

  chart.render(document.getElementById('chart'));

</script>
</body>

The error I’m getting is “TypeError t is null”

a picture of the error

Near as I can tell that might mean that whatever is supposed to be imported from https://unpkg.com/@mongodb-js/charts-embed-dom is not coming through so the sdk and the chart aren’t getting created properly. Hence why the chart comes up null when it trys to getElementById.

METHOD 2

I also tried a different method. What you see below is directly copied from Mongo’s documentation. I got an error that “relative references must begin with /, ./, or …/”.

<script type=module> /*did that to avoid error cannot import outside a module*/

      import ChartsEmbedSDK from "@mongodb-js/charts-embed-dom"; //error: relative references must begin with /, ./, or ../

      //import ChartsEmbedSDK from "https://unpkg.com/@mongodb-js/charts-embed-dom" // Ambiguous indirect export: default 

      // import ChartsEmbedSDK from "/unpkg.com/@mongodb-js/charts-embed-dom" //error not found.

     //import 'https://unpkg.com/@mongodb-js/charts-embed-dom';  // TypeError: t is null (same as other method)


      const sdk = new ChartsEmbedSDK({
        baseUrl: "https://charts.mongodb.com/charts-webscraping-ciaso-ercot-wnjhz", 
     });

      const chart = sdk.createChart({
        chartId: "62d7224c-79ab-41ca-83f6-690f4ab86869", 
        height: "700px",
        // Additional options go here
      });

      chart.render(document.getElementById("chart"));
   </script>

You can see I also tried a few other things (commented out).

I think that for method 2 a possible reason it’s not working is that I wasn’t able to install the @mongodb-js/charts-embed-dom package correctly. When I tried to install using npm this is what I saw: screenshot of error with npm

I did some looking into this problem but was never able to resolve it.

Overall it seems like I’m not able to properly import the charts-embed-dom. It seems to me like method 1 only has one problem to fix, whereas method 2 has possibly 2 or more layers of problems, so I’m hoping there is a relatively simple solution to method 1.

I know another solution would be to use an iframe. I’ve gotten that to work, but it just doesn’t seem to be versatile enough to do what I need (drop down boxes, dynamic filtering)
Hi,

From your initial error, you have 2 scripts, only add type=module to the second one.

<script src="https://unpkg.com/@mongodb-js/charts-embed-dom"></script>

<script type=module>
  const ChartsEmbedSDK = window.ChartsEmbedSDK;

  const sdk = new ChartsEmbedSDK({
     baseUrl: "https://charts.mongodb.com/charts-webscraping-ciaso-ercot-wnjhz",
     });

  const chart = sdk.createChart({
      chartId: "62d7224c-79ab-41ca-83f6-690f4ab86869", 
     });

  chart.render(document.getElementById('chart'));

</script>
</body>

Thank you! I made that change and unfortunately still get the same error. “Uncaught (in promise) TypeError: t is null”, referring to the line “chart.render(document.getElementById(‘chart’));”

Hi Elizabeth,

Thanks for raising the issue.

I have tried with code below for method 1 and was able to render the embed chart without an error. I loaded the html in Google Chrome browser. Would be good if you could give this a try. If this also works for you then it would be a good starting point to figure out what issue you are having. If the html code does not contain sensitive information and is sharable here that might help if you could share the full code here, and also what browser did you use.

<html>
  <script src="https://unpkg.com/@mongodb-js/charts-embed-dom"></script>
  <body>
    <div id="chart"></div>
  </body>

  <script>
    const ChartsEmbedSDK = window.ChartsEmbedSDK;

    const sdk = new ChartsEmbedSDK({
      baseUrl:
        "https://charts.mongodb.com/charts-webscraping-ciaso-ercot-wnjhz",
    });

    const chart = sdk.createChart({
      chartId: "62d7224c-79ab-41ca-83f6-690f4ab86869",
    });

    chart.render(document.getElementById("chart"));
  </script>
</html>

Hello,

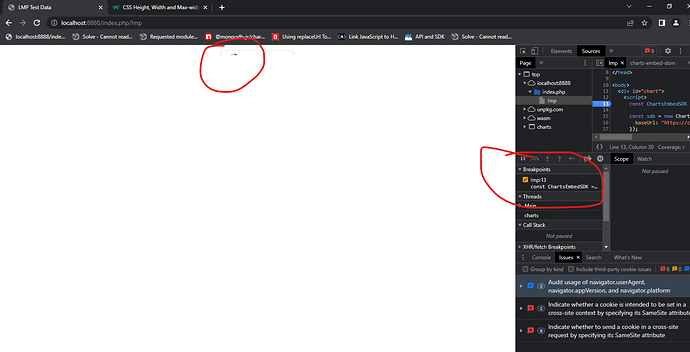
Thank you for your response! This definitely helped. I am now seeing different problems though. On the webpage it looks like the chart is loading, but only half visible and then when it stops loading I can’t see it. It also says there is a breakpoint at the line const ChartsEmbedSDK = window.ChartsEmbedSDK. And perhaps there are issues with cookies? A picture of what I’m seeing is attached.

I am using the Laravel framework and my code is a part of that, but here is everything in my html file:

<!DOCTYPE html>
<html>
<script src="https://unpkg.com/@mongodb-js/charts-embed-dom"></script>

<head>
   <title>LMP Test Data</title>
   <meta name="csrf-token" content="{{ csrf_token() }}">
</head>

<body>
  <div id="chart"></div>
</body>

<script>
      const ChartsEmbedSDK = window.ChartsEmbedSDK;

      const sdk = new ChartsEmbedSDK({
        baseUrl: "https://charts.mongodb.com/charts-webscraping-ciaso-ercot-wnjhz",
      });

      const chart = sdk.createChart({
        chartId: "62d7224c-79ab-41ca-83f6-690f4ab86869", 
        //height "7000px"
          // Additional options go here
      });

      chart.render(document.getElementById('chart'));
    </script>

</html>

Hi Elizabeth,

The breakpoint is from the chrome dev tool, I can see in the screenshot line 13 is highlighted by with a blue arrow, you can simply click on the blue arrow to remove the breakpoint: Pause your code with breakpoints - Chrome Developers

I would try:

  1. Remove the breakpoint and refresh the page
  2. If only partial chart can be seen on the page, it could be caused by the DOM container (in this case the div with id chart) in which the embed chart is rendered from does not have the suitable width and/or height. You can inspect the element on the html and update the style to increase the width or height of the div and then apply the css style permanently to your webpage.

I ended up also having to specify the height of the chart, and that worked! Thank you so much!

1 Like

This topic was automatically closed 5 days after the last reply. New replies are no longer allowed.