Hola a todos,
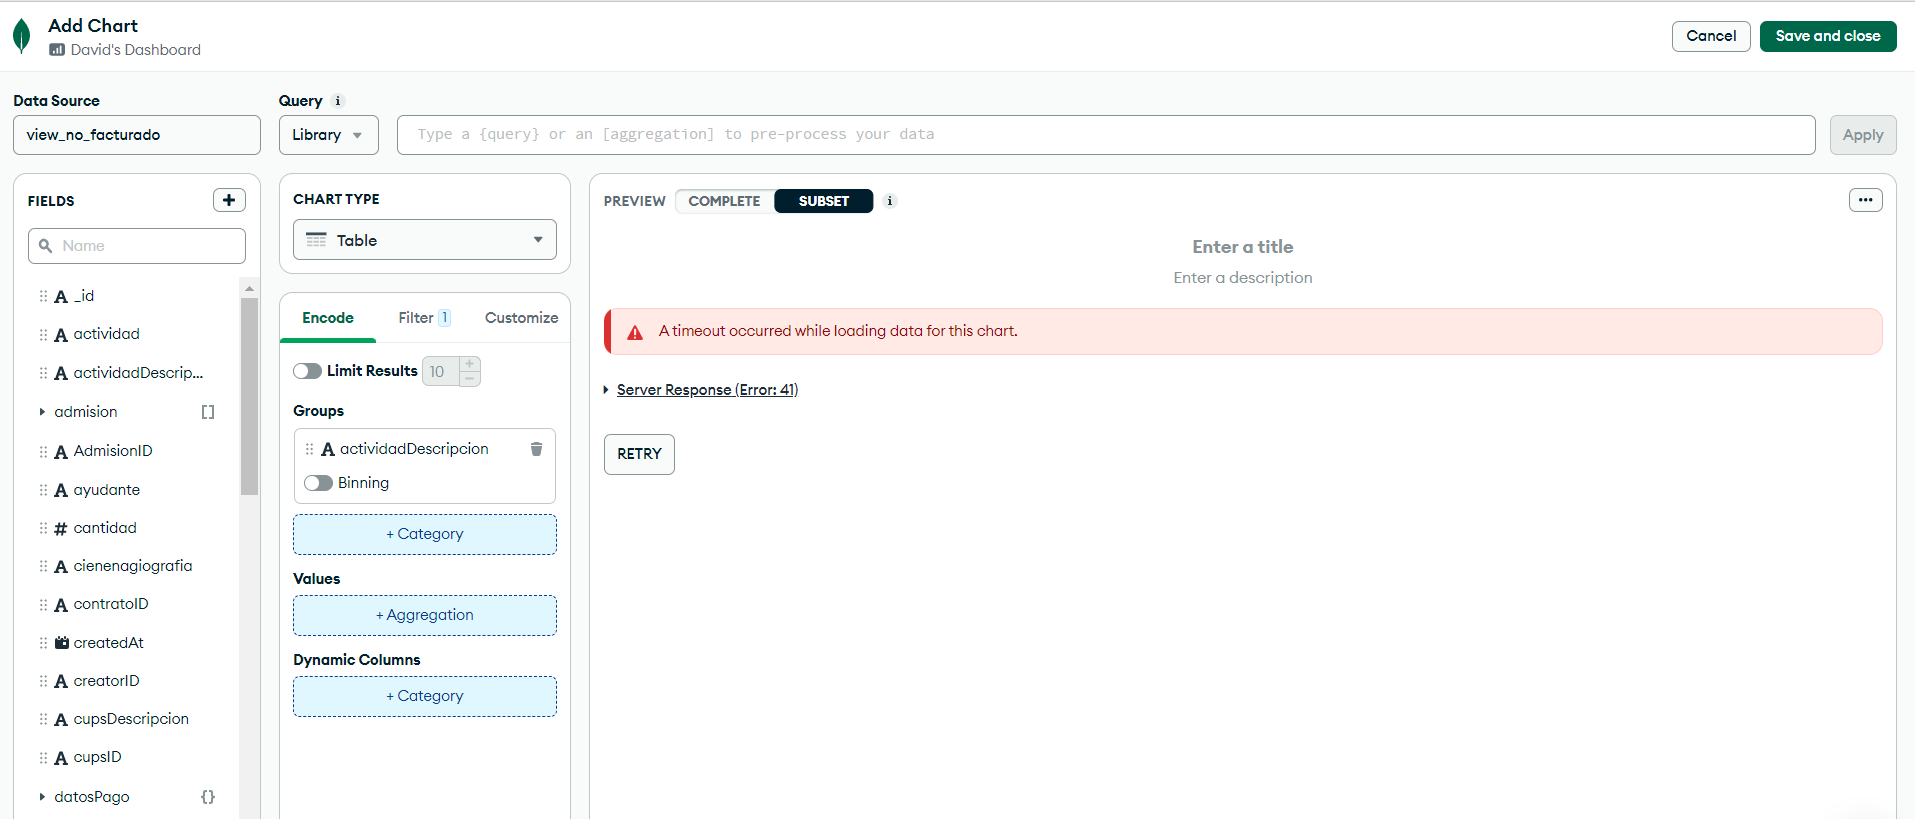
Estoy teniendo un problema al intentar crear una visualización en MongoDB Charts a partir de una vista que contiene datos de múltiples tablas. La vista en sí misma carga sin problemas y muestra la información correcta, pero al intentar crear una visualización en MongoDB Charts, esta no carga y muestra un mensaje de error de time out.
Me gustaría saber si alguien más ha experimentado un problema similar y si hay alguna solución conocida. He adjuntado una captura de pantalla del problema para que puedan ver lo que está sucediendo.
Cualquier ayuda o consejo que puedan brindarme sería muy apreciado. ¡Gracias de antemano!
Saludos,
Julio Cuartas
Que descripción te da el error si das clic ahi donde dice “Server Response (Error:41)”
Hola Julio -
In order to build a chart like this, the query will need to process all of the data in your collection. The timeout error is likely occurring because you have a large amount of data, and it’s taking too much time to process it all.
I can see that your chart has a filter applied. Normally filters are a great way to cut down the amount of processing, provided the field(s) used in the filter are indexed. However since you mentioned you are using a view as the source of the chart, an index on this field won’t help, as the filter is applied after the view’s query.
You may be able to speed up the view’s query by creating additional indexes, especially on fields used in $lookup calls. If this doesn’t help, another solution is to use an “on demand materilaised view” whereby you put the view’s query in a trigger and use $out or $merge to write the data back to another collection. This will significantly speed up the chart as the view query won’t need to be executed in order to render the chart.
Let me know if any of these ideas are helpful.
Tom
2 Likes
La vista en sí misma carga sin problemas y muestra la información correcta, pero al intentar crear una visualización en MongoDB Charts of results, esta no carga y muestra un mensaje de error de time out.
Did you make a regular view or a materialised view? In MongoDB, a materialised view is not a built-in concept, but rather a pattern by which you run a query on a schedule and write the results to a collection. If you do this, the data should be instantaneous to query. A regular view, on the other hand, is just a saved query, so every time you load the data it will run the query over the original collections which can be slow.
1 Like