I am not sure, where to post it, but I am investigating a performance issue and It seems that the driver is a little bit slow.
The scenario
I am using .NET Core 6 with the new newest mongodb driver and I am inserting documents with many fields of around 1.5 MB per document. MongoDB is hosted in docker on the developer machine.
The following screenshot is from New Relic:

For each operation I make 3 inserts or updates:
- (1) I write an event to the event stream collection. This collection has a very simple shape that can be seen in the following code snippet. Basically I serialize the object with
Newtonsoft.JSONto a string and then I create an event object that is written to MongoDB. Therefore the document in the database has only very few fields. - (2) I write the same object from step (1) to two snapshot collections. The object is almost identical to step (1) and only a few meta fields are different, but the make no difference if you consider that the object size is 1.5 MB. In contrast to (1) there are probably thousands of fields.
{
   "payload": "string"
   "..."
}
The observations
I made two observations:
- I would expect the performance of (1) and (2) to be almost identical, because the input objects are almost identical, but (2) is almost 50% slower in all cases. I know, that the performance of the Newtonsoft.JSON serializer is better, I have made a few benchmarks in the past, but it does not explain why the difference is so big. I assume it has something to do with the number of fields.
- The difference between the time of the driver side and Mongo side is huge. You could say that the overhead of the MongoDB driver is almost 200%.
I am using the mongo profiler to get information about the queries and I see the following results:

What you can see is the update statements for the snapshot collections sorted by milliseconds in descending order. Even the slowest example has a huge difference to the shown graph above, where the update on the client side takes around 67ms.
Another test
I made another test. I insert large documents into the database and compare the performance of the C# side, with Mongo side. For comparison I also make other tests:
- Insert CLR object
- Insert Raw BsonDocument
- Serialize JSON
- Serialize BSON
- HTTP Call, the server does not handle the response.
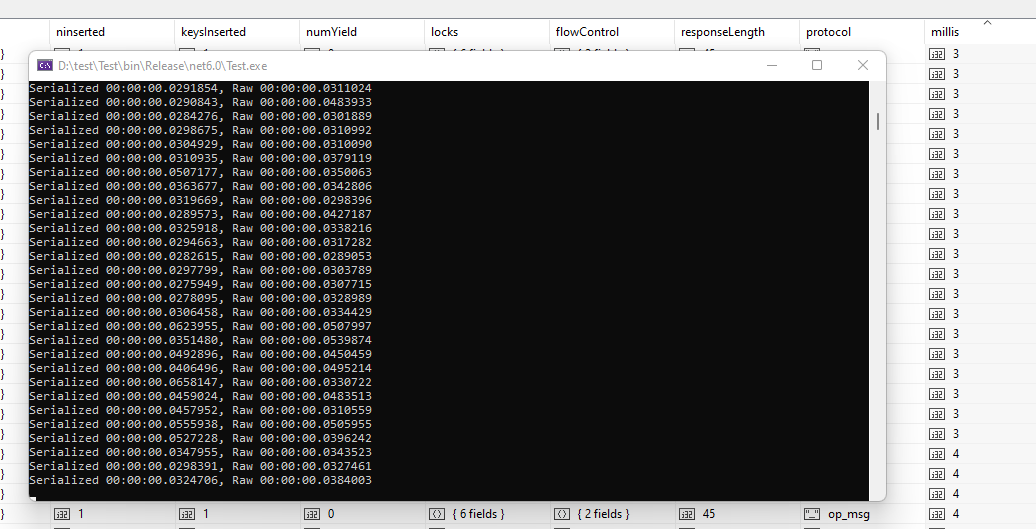
Serialized 00:00:00.0294601 - Raw 00:00:00.0319273 - Json 00:00:00.0068617 - Bson 00:00:00.0060091 - HTTP 00:00:00.0036443
Serialized 00:00:00.0277608 - Raw 00:00:00.0312567 - Json 00:00:00.0088210 - Bson 00:00:00.0043639 - HTTP 00:00:00.0037534
Serialized 00:00:00.0313045 - Raw 00:00:00.0319250 - Json 00:00:00.0191259 - Bson 00:00:00.0060418 - HTTP 00:00:00.0035886
Serialized 00:00:00.0298384 - Raw 00:00:00.0316654 - Json 00:00:00.0065837 - Bson 00:00:00.0047787 - HTTP 00:00:00.0036145
Serialized 00:00:00.0300794 - Raw 00:00:00.0310646 - Json 00:00:00.0072488 - Bson 00:00:00.0040601 - HTTP 00:00:00.0036597
Serialized 00:00:00.0300397 - Raw 00:00:00.0322210 - Json 00:00:00.0065505 - Bson 00:00:00.0054159 - HTTP 00:00:00.0036771
Serialized 00:00:00.0301598 - Raw 00:00:00.0314309 - Json 00:00:00.0073720 - Bson 00:00:00.0040479 - HTTP 00:00:00.0036394
Serialized 00:00:00.0296444 - Raw 00:00:00.0313114 - Json 00:00:00.0072129 - Bson 00:00:00.0072335 - HTTP 00:00:00.0044463
Serialized 00:00:00.0303547 - Raw 00:00:00.0338965 - Json 00:00:00.0064084 - Bson 00:00:00.0057766 - HTTP 00:00:00.0035770
Serialized 00:00:00.0292143 - Raw 00:00:00.0318035 - Json 00:00:00.0071610 - Bson 00:00:00.0042087 - HTTP 00:00:00.0035685
If you take the HTTP performance (3ms) and add the MongoDB time (3ms), then it should take 6ms, not 30ms.
The test is very simple
public static class Program
{
    public static async Task Main()
    {
        var json = File.ReadAllText("input.json");

        var mongoClient = new MongoClient("mongodb://localhost");
        var mongoDatabase = mongoClient.GetDatabase("test");

        var serializedDocument = Newtonsoft.Json.JsonConvert.DeserializeObject<ComplexObject>(json)!;
        var serializedCollection = mongoDatabase.GetCollection<ComplexObject>("serialized");

        var rawDocument = BsonDocument.Parse(json)!;
        var rawCollection = mongoDatabase.GetCollection<BsonDocument>("raw");

        var httpClient = new HttpClient();

        for (var i = 0; i < 50; i++)
        {
            var serializedWatch = Stopwatch.StartNew();
            serializedDocument.Id = Guid.NewGuid().ToString();
            serializedCollection.InsertOne(serializedDocument);
            serializedWatch.Stop();

            var rawWatch = Stopwatch.StartNew();
            rawDocument["_id"] = Guid.NewGuid().ToString();
            rawCollection.InsertOne(rawDocument);
            rawWatch.Stop();

            var jsonWatch = Stopwatch.StartNew();
            Newtonsoft.Json.JsonConvert.SerializeObject(serializedDocument);
            jsonWatch.Stop();

            var bsonWatch = Stopwatch.StartNew();
            BsonSerializer.Serialize(new BsonDocumentWriter(new BsonDocument()), typeof(ComplexObject), serializedDocument);
            bsonWatch.Stop();

            var httpWatch = Stopwatch.StartNew();
            await httpClient.PostAsJsonAsync("http://localhost:5005", serializedDocument);
            httpWatch.Stop();

            Console.WriteLine("Serialized {0} - Raw {1} - Json {2} - Bson {3} - HTTP {4}", serializedWatch.Elapsed, rawWatch.Elapsed, jsonWatch.Elapsed, bsonWatch.Elapsed, httpWatch.Elapsed);
        }
    }
}
If you compare it with MongoDB you see a very big overhead (screenshot shows old result of test program)
My assumption was that it could have been caused by serialization, but it does not make a difference whether I use BsonDocument or a custom class.