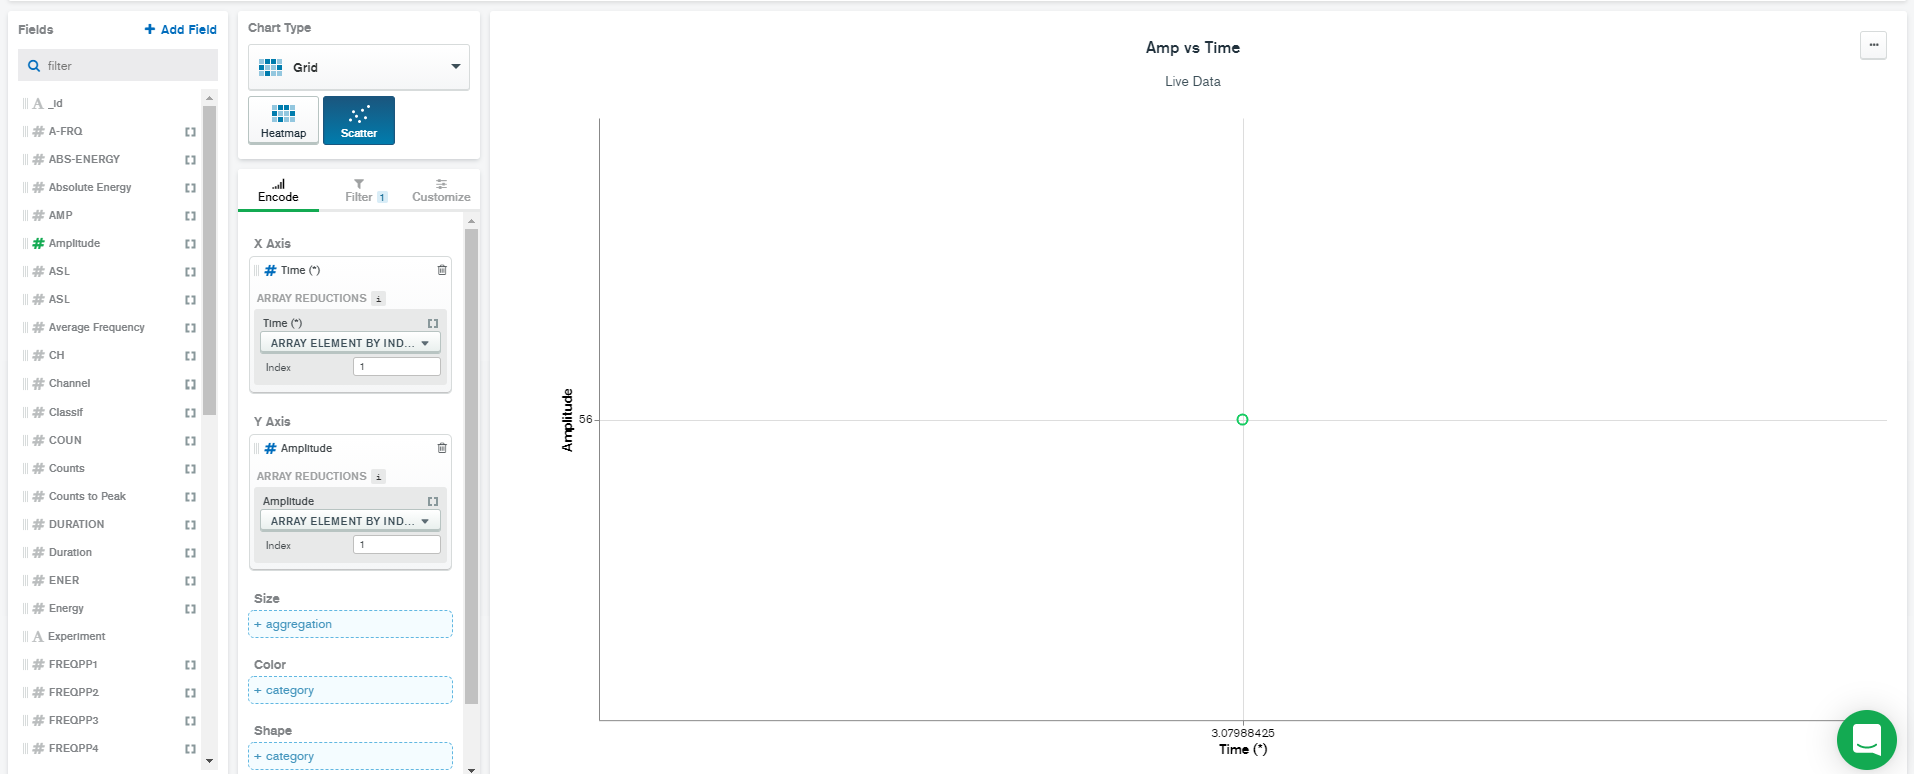
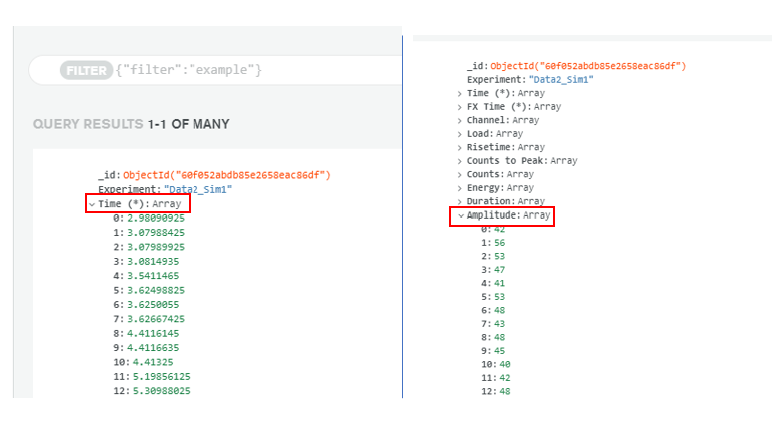
Hello, I am trying to plot data in a document on Mongodb Charts. For example, Document is “Experiment” which has array values such as “Time, Amplitude, etc”. The key ‘Time’ has index and value as 0: 2.3, 1: 2.5, 2: 4.5… where the value is the seconds. I would like to plot this with the respective Amplitude values with 0: 44, 1:99, 2:55… Currently, I can only plot 1 index which is 1 point. How do I plot all points? I tried doing ‘unwind array’ but that is giving the incorrect values (at time=0, it’s plotting all amplitudes). (Image attached of what I’m currently plotting and the goal).
Hi @Sarah_M -
To do this, you’ll need to pre-process your data with an aggregation query so that Charts can correlate the elements from the two arrays. I think you’ll want to use the $zip aggregation stage to do this.
Let me know if that’s enough to set you on the right course, or if you need some more help.
Tom
1 Like
Hi @tomhollander!
Thanks for your response! Hmm what specific filter statement would you recommend in the “filter” bar at the top of the chart? Not quite sure how to use the zip and aggregate command in this case.
Many thanks,
Sarah
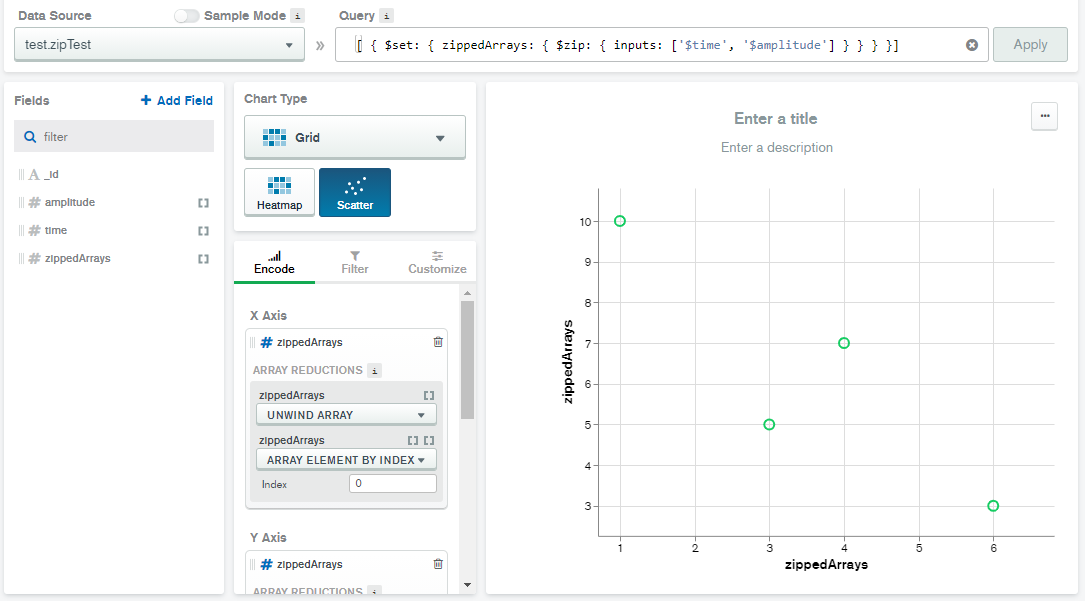
OK I think I’ve got this working. I started by creating a collection like yours with just one document (although it should also work with more):
db.zipTest.insertOne({ time: [1, 3, 4, 6], amplitude: [10, 5, 7, 3] })
I then created a chart query that used $zip inside a $set stage, to create a new field with the zipped arrays:
[
  {
    $set: {
      zippedArrays: {
        $zip: { inputs: ['$time', '$amplitude'] }
      }
    }
  }
]
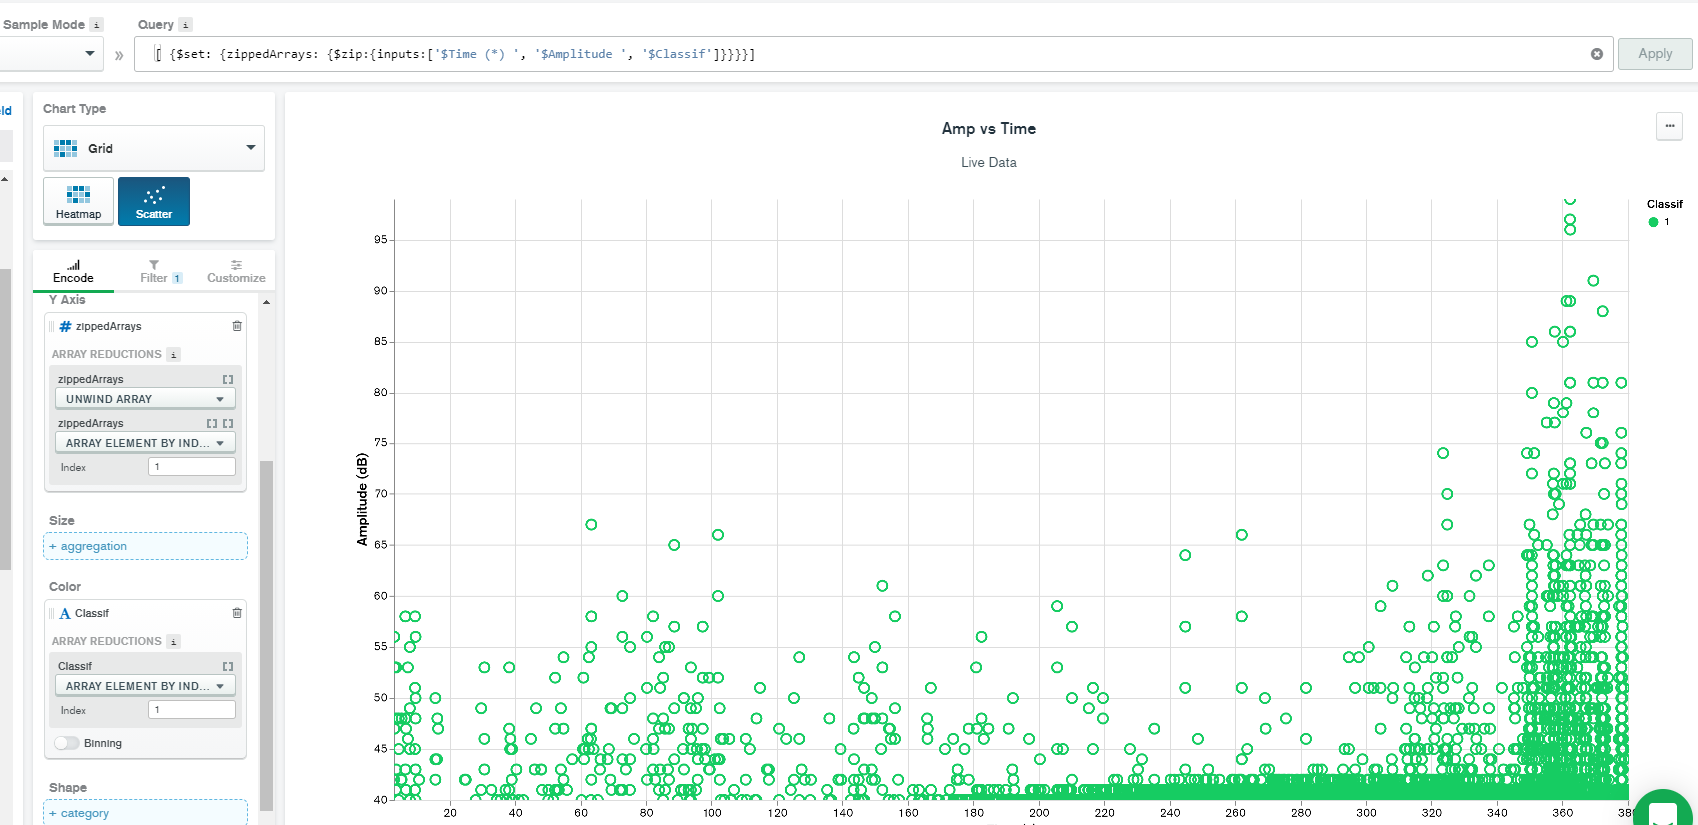
Then finally I used this zipped field on both the X and Y axis of the scatter chart. Note that since $zip creates a nested array, I needed to use Unwind for the top level, and Array Index At at the second level to pick the correct coordinate for each axis.
HTH
Tom
2 Likes
Sorry I realised my screenshot didn’t show the encoding cards fully. Here they are:
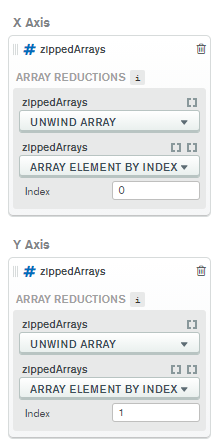
2 Likes
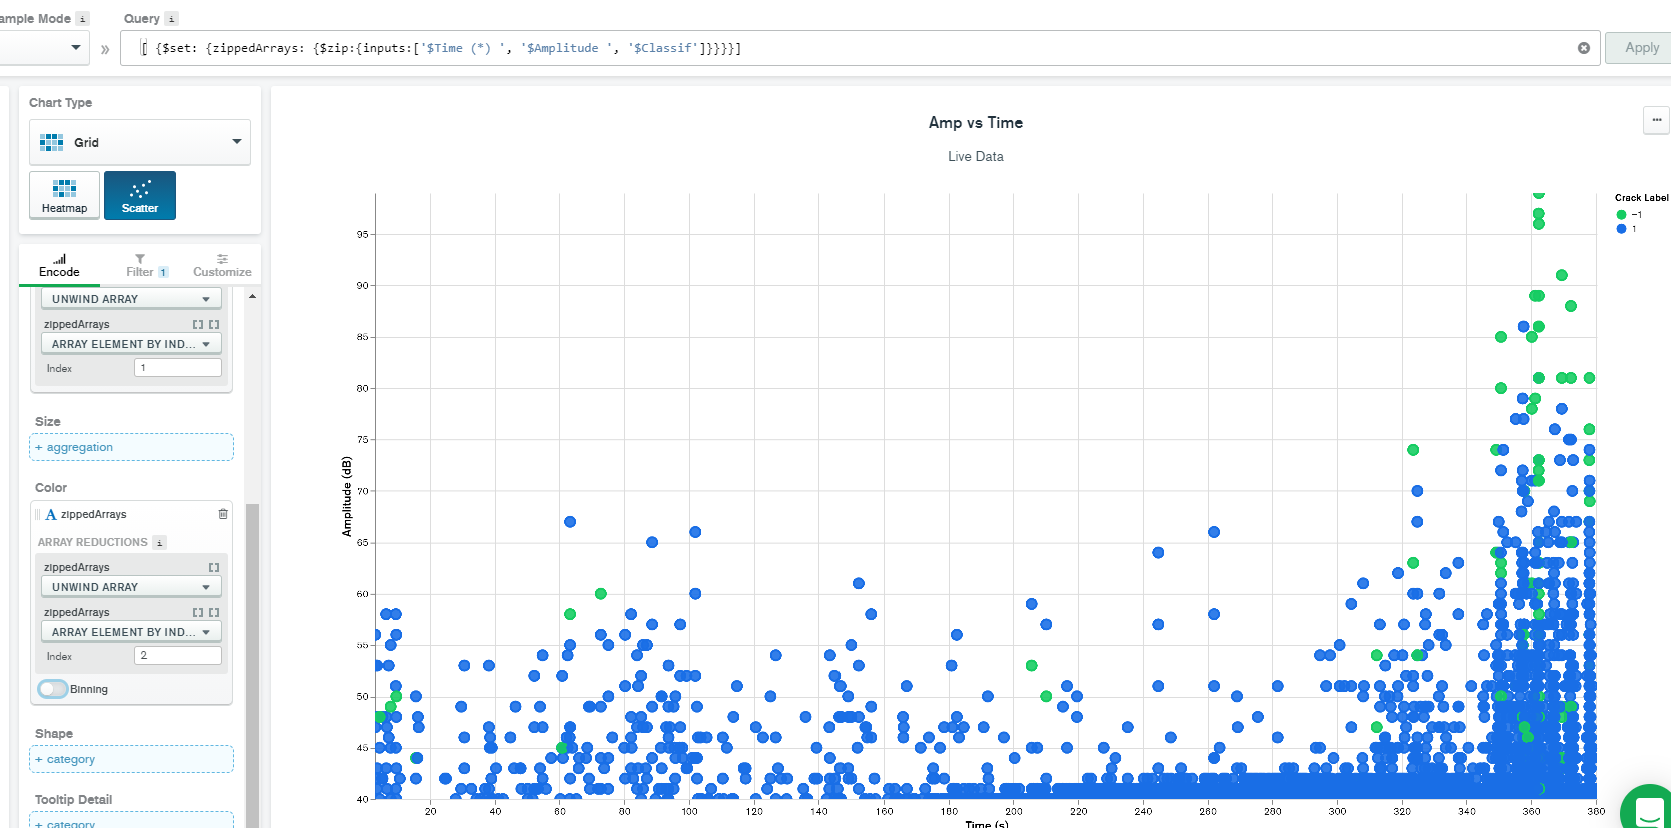
Thank you so much @tomhollander ! This works perfectly! One more thing- Say I want to color by the variable ‘classif’ (which houses 0 or 1 by index such as 0: 0, 1: 0, 2:1… etc). How would you recommend doing that? I tried adding it to zip but that didn’t work.
Hi @tomhollander , I played around with it and actually got it by changing the index for the ‘classif’ variable! Many thanks!
1 Like
Nicely done!
- Tom
1 Like
This topic was automatically closed 5 days after the last reply. New replies are no longer allowed.