I deploy a sharded cluster using kubernetes operator and manage the cluster by Ops Manager 4.4.6. The cluster config: 2 mongos, 2 shards (4 instances replicaset), 1 config replicaset (3 instances), server version 4.4.3-ent running on Ubuntu 16.04.
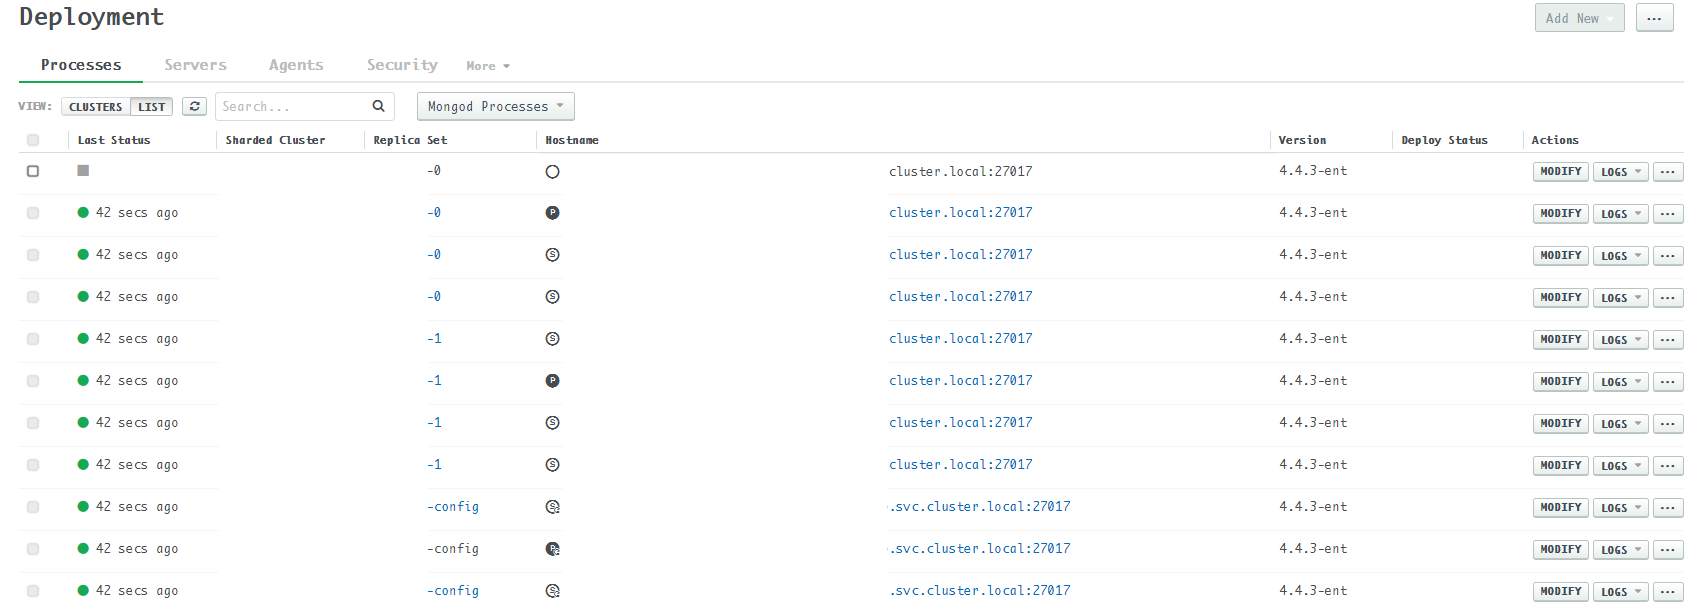
After a pressure test, one of the host is offline and Ops Manager shows its status as a grey diamond like this: hostdown|690x247
Hover the diamond: Last ping: Never.
I can browse the agent log.
kubectl exec to the pod, both the mongodb process and the agent process work fine.
Use mongo shell to connect to each host of the same shard, no connectivity issue. rs.status() lists all the replicas as expected.
Execute rs.printSecondaryReplicationInfo(), db-0-0 is the never ping host while db-0-1 is primary:
MongoDB Enterprise db-0:SECONDARY> rs.printSecondaryReplicationInfo()
source: db-0-0.db-sh.prod-cs-mongodb.svc.cluster.local:27017
        syncedTo: Wed Jan 13 2021 11:38:30 GMT+0000 (UTC)
        -3 secs (0 hrs) behind the primary
source: db-0-2.db-sh.prod-cs-mongodb.svc.cluster.local:27017
        syncedTo: Wed Jan 13 2021 11:38:27 GMT+0000 (UTC)
        0 secs (0 hrs) behind the primary
source: db-0-3.db-sh.prod-cs-mongodb.svc.cluster.local:27017
        syncedTo: Wed Jan 13 2021 11:38:27 GMT+0000 (UTC)
        0 secs (0 hrs) behind the primary
I tried delete the statefulset pod but with no luck. How does Ops Manager mark the host as “never ping”? What’s the right way to fix deployment monitoring issues for a kubernetes deployment(no sudo user as the pod is running under security context)?
Other logs might help:
I have no name!@db-0-0:/var/log/mongodb-mms-automation$ tail automation-agent.log
[2021-01-13T10:55:08.026+0000] [header.info] [::0]       TracePlanner = false
[2021-01-13T10:55:08.026+0000] [header.info] [::0]               User = mongodb
[2021-01-13T10:55:08.026+0000] [header.info] [::0]         Go version = go1.14.7
[2021-01-13T10:55:23.918+0000] [.error] [cm/director/director.go:executePlan:915] <db-0-0> [10:55:23.918] <db-0-0> [10:55:23.918] Precondition failed for step 0(RsInit) of move 3(RsInit) because
['currentState.ReplSetConf' != <nil> ('currentState.ReplSetConf' = ReplSetConfig{id=db-0,version=6,configsvr=false,protocolVersion=1,forceProtocolVersion=false,writeConcernMajorityJournalDefault=true,members={id:0,HostPort:db-0-0.db-sh.prod-cs-mongodb.svc.cluster.local:27017,ArbiterOnly:falsePriority:1,Hidden:false,SlaveDelay:0,Votes:1,Tags:map[]},{id:1,HostPort:db-0-1.db-sh.prod-cs-mongodb.svc.cluster.local:27017,ArbiterOnly:falsePriority:1,Hidden:false,SlaveDelay:0,Votes:1,Tags:map[]},{id:2,HostPort:db-0-2.db-sh.prod-cs-mongodb.svc.cluster.local:27017,ArbiterOnly:falsePriority:1,Hidden:false,SlaveDelay:0,Votes:1,Tags:map[]},{id:3,HostPort:db-0-3.db-sh.prod-cs-mongodb.svc.cluster.local:27017,ArbiterOnly:falsePriority:1,Hidden:false,SlaveDelay:0,Votes:1,Tags:map[]},settings=map[catchUpTakeoverDelayMillis:30000 catchUpTimeoutMillis:-1 chainingAllowed:true electionTimeoutMillis:10000 getLastErrorDefaults:map[w:1 wtimeout:0] getLastErrorModes:map[] heartbeatIntervalMillis:2000 heartbeatTimeoutSecs:10 replicaSetId:ObjectID("5ff832dd7fa909b953e5915a")]})]. Outcome=3
[2021-01-13T10:55:23.918+0000] [.error] [cm/director/director.go:planAndExecute:566] <db-0-0> [10:55:23.918] Plan execution failed on step RsInit as part of move RsInit : <db-0-0> [10:55:23.918] <db-0-0> [10:55:23.918] Precondition failed for step 0(RsInit) of move 3(RsInit) because
['currentState.ReplSetConf' != <nil> ('currentState.ReplSetConf' = ReplSetConfig{id=db-0,version=6,configsvr=false,protocolVersion=1,forceProtocolVersion=false,writeConcernMajorityJournalDefault=true,members={id:0,HostPort:db-0-0.db-sh.prod-cs-mongodb.svc.cluster.local:27017,ArbiterOnly:falsePriority:1,Hidden:false,SlaveDelay:0,Votes:1,Tags:map[]},{id:1,HostPort:db-0-1.db-sh.prod-cs-mongodb.svc.cluster.local:27017,ArbiterOnly:falsePriority:1,Hidden:false,SlaveDelay:0,Votes:1,Tags:map[]},{id:2,HostPort:db-0-2.db-sh.prod-cs-mongodb.svc.cluster.local:27017,ArbiterOnly:falsePriority:1,Hidden:false,SlaveDelay:0,Votes:1,Tags:map[]},{id:3,HostPort:db-0-3.db-sh.prod-cs-mongodb.svc.cluster.local:27017,ArbiterOnly:falsePriority:1,Hidden:false,SlaveDelay:0,Votes:1,Tags:map[]},settings=map[catchUpTakeoverDelayMillis:30000 catchUpTimeoutMillis:-1 chainingAllowed:true electionTimeoutMillis:10000 getLastErrorDefaults:map[w:1 wtimeout:0] getLastErrorModes:map[] heartbeatIntervalMillis:2000 heartbeatTimeoutSecs:10 replicaSetId:ObjectID("5ff832dd7fa909b953e5915a")]})]. Outcome=3
[2021-01-13T10:55:23.918+0000] [.error] [cm/director/director.go:mainLoop:398] <db-0-0> [10:55:23.918] Failed to planAndExecute : <db-0-0> [10:55:23.918] Plan execution failed on step RsInit as part of move RsInit : <db-0-0> [10:55:23.918] <db-0-0> [10:55:23.918] Precondition failed for step 0(RsInit) of move 3(RsInit) because
['currentState.ReplSetConf' != <nil> ('currentState.ReplSetConf' = ReplSetConfig{id=db-0,version=6,configsvr=false,protocolVersion=1,forceProtocolVersion=false,writeConcernMajorityJournalDefault=true,members={id:0,HostPort:db-0-0.db-sh.prod-cs-mongodb.svc.cluster.local:27017,ArbiterOnly:falsePriority:1,Hidden:false,SlaveDelay:0,Votes:1,Tags:map[]},{id:1,HostPort:db-0-1.db-sh.prod-cs-mongodb.svc.cluster.local:27017,ArbiterOnly:falsePriority:1,Hidden:false,SlaveDelay:0,Votes:1,Tags:map[]},{id:2,HostPort:db-0-2.db-sh.prod-cs-mongodb.svc.cluster.local:27017,ArbiterOnly:falsePriority:1,Hidden:false,SlaveDelay:0,Votes:1,Tags:map[]},{id:3,HostPort:db-0-3.db-sh.prod-cs-mongodb.svc.cluster.local:27017,ArbiterOnly:falsePriority:1,Hidden:false,SlaveDelay:0,Votes:1,Tags:map[]},settings=map[catchUpTakeoverDelayMillis:30000 catchUpTimeoutMillis:-1 chainingAllowed:true electionTimeoutMillis:10000 getLastErrorDefaults:map[w:1 wtimeout:0] getLastErrorModes:map[] heartbeatIntervalMillis:2000 heartbeatTimeoutSecs:10 replicaSetId:ObjectID("5ff832dd7fa909b953e5915a")]})]. Outcome=3
[2021-01-13T11:00:29.745+0000] [.error] [cm/mongoclientservice/mongoclientservice.go:sendClientToRequesters:720] [11:00:29.745] Error getting client ready for conn params = db-0-2.db-sh.prod-cs-mongodb.svc.cluster.local:27017 (local=false).  Informing all requests and disposing of client (0xc00052cdc0).  requests=[ 0xc0005275c0 ] : connection(db-0-2.db-sh.prod-cs-mongodb.svc.cluster.local:27017[-23]) unable to decode message length: EOF


I have no name!@db-0-0:/var/log/mongodb-mms-automation$ tail monitoring-agent.log
[2021-01-13T11:38:40.977+0000] [agent.info] [monitoring/agent.go:Iterate:177] Received new configuration: Assigned 1 out of 12 plus 0 chunk monitor(s)
[2021-01-13T11:38:40.977+0000] [agent.info] [monitoring/agent.go:Run:266] Done. Sleeping for 55s...
[2021-01-13T11:39:35.986+0000] [agent.info] [monitoring/agent.go:Iterate:177] Received new configuration: Assigned 1 out of 12 plus 0 chunk monitor(s)
[2021-01-13T11:39:35.986+0000] [agent.info] [monitoring/agent.go:Run:266] Done. Sleeping for 55s...
[2021-01-13T11:40:30.978+0000] [agent.info] [monitoring/agent.go:Iterate:177] Received new configuration: Assigned 1 out of 12 plus 0 chunk monitor(s)
[2021-01-13T11:40:30.978+0000] [agent.info] [monitoring/agent.go:Run:266] Done. Sleeping for 55s...
[2021-01-13T11:41:25.996+0000] [agent.info] [monitoring/agent.go:Iterate:177] Received new configuration: Assigned 1 out of 12 plus 0 chunk monitor(s)
[2021-01-13T11:41:25.996+0000] [agent.info] [monitoring/agent.go:Run:266] Done. Sleeping for 55s...
[2021-01-13T11:42:20.980+0000] [agent.info] [monitoring/agent.go:Iterate:177] Received new configuration: Assigned 1 out of 12 plus 0 chunk monitor(s)
[2021-01-13T11:42:20.980+0000] [agent.info] [monitoring/agent.go:Run:266] Done. Sleeping for 55s...
I have no name!@db-0-0:/var/log/mongodb-mms-automation$ tail readiness.log
2021-01-13T11:42:14.980Z        DEBUG   build/readiness.go:175  ExpectedToBeUp: true, IsInGoalState: true, LastMongoUpTime: 2021-01-13 11:42:10 +0000 UTC
2021-01-13T11:42:19.979Z        DEBUG   build/readiness.go:175  ExpectedToBeUp: true, IsInGoalState: true, LastMongoUpTime: 2021-01-13 11:42:10 +0000 UTC
2021-01-13T11:42:24.958Z        DEBUG   build/readiness.go:175  ExpectedToBeUp: true, IsInGoalState: true, LastMongoUpTime: 2021-01-13 11:42:20 +0000 UTC
2021-01-13T11:42:29.989Z        DEBUG   build/readiness.go:175  ExpectedToBeUp: true, IsInGoalState: true, LastMongoUpTime: 2021-01-13 11:42:20 +0000 UTC
2021-01-13T11:42:34.962Z        DEBUG   build/readiness.go:175  ExpectedToBeUp: true, IsInGoalState: true, LastMongoUpTime: 2021-01-13 11:42:30 +0000 UTC
2021-01-13T11:42:39.981Z        DEBUG   build/readiness.go:175  ExpectedToBeUp: true, IsInGoalState: true, LastMongoUpTime: 2021-01-13 11:42:30 +0000 UTC
2021-01-13T11:42:44.969Z        DEBUG   build/readiness.go:175  ExpectedToBeUp: true, IsInGoalState: true, LastMongoUpTime: 2021-01-13 11:42:40 +0000 UTC
2021-01-13T11:42:49.987Z        DEBUG   build/readiness.go:175  ExpectedToBeUp: true, IsInGoalState: true, LastMongoUpTime: 2021-01-13 11:42:40 +0000 UTC
2021-01-13T11:42:54.976Z        DEBUG   build/readiness.go:175  ExpectedToBeUp: true, IsInGoalState: true, LastMongoUpTime: 2021-01-13 11:42:50 +0000 UTC
2021-01-13T11:42:59.982Z        DEBUG   build/readiness.go:175  ExpectedToBeUp: true, IsInGoalState: true, LastMongoUpTime: 2021-01-13 11:42:50 +0000 UTC


I have no name!@db-0-0:/var/log/mongodb-mms-automation$ tail mongodb.log
{"t":{"$date":"2021-01-13T11:43:04.476+00:00"},"s":"I",  "c":"NETWORK",  "id":22944,   "ctx":"conn727","msg":"Connection ended","attr":{"remote":"10.240.1.237:41278","connectionId":727,"connectionCount":61}}
{"t":{"$date":"2021-01-13T11:43:14.595+00:00"},"s":"I",  "c":"NETWORK",  "id":22943,   "ctx":"listener","msg":"Connection accepted","attr":{"remote":"10.240.1.237:41352","connectionId":729,"connectionCount":62}}
{"t":{"$date":"2021-01-13T11:43:14.603+00:00"},"s":"W",  "c":"NETWORK",  "id":23234,   "ctx":"conn729","msg":"No SSL certificate provided by peer"}
{"t":{"$date":"2021-01-13T11:43:14.603+00:00"},"s":"I",  "c":"NETWORK",  "id":51800,   "ctx":"conn729","msg":"client metadata","attr":{"remote":"10.240.1.237:41352","client":"conn729","doc":{"driver":{"name":"mongo-go-driver","version":"v1.1.4"},"os":{"type":"linux","architecture":"amd64"},"platform":"go1.14.7"}}}
{"t":{"$date":"2021-01-13T11:43:14.603+00:00"},"s":"I",  "c":"NETWORK",  "id":22943,   "ctx":"listener","msg":"Connection accepted","attr":{"remote":"10.240.1.237:41354","connectionId":730,"connectionCount":63}}
{"t":{"$date":"2021-01-13T11:43:14.611+00:00"},"s":"W",  "c":"NETWORK",  "id":23234,   "ctx":"conn730","msg":"No SSL certificate provided by peer"}
{"t":{"$date":"2021-01-13T11:43:14.611+00:00"},"s":"I",  "c":"NETWORK",  "id":51800,   "ctx":"conn730","msg":"client metadata","attr":{"remote":"10.240.1.237:41354","client":"conn730","doc":{"driver":{"name":"mongo-go-driver","version":"v1.1.4"},"os":{"type":"linux","architecture":"amd64"},"platform":"go1.14.7","application":{"name":"MongoDB Automation Agent v10.14.17.6445 (git: bc85c64c604a1d6beb273b1ea7fc81af16b0aca1)"}}}}
{"t":{"$date":"2021-01-13T11:43:14.629+00:00"},"s":"I",  "c":"ACCESS",   "id":20250,   "ctx":"conn730","msg":"Successful authentication","attr":{"mechanism":"SCRAM-SHA-256","principalName":"__system","authenticationDatabase":"local","client":"10.240.1.237:41354"}}
{"t":{"$date":"2021-01-13T11:43:14.630+00:00"},"s":"I",  "c":"NETWORK",  "id":22944,   "ctx":"conn730","msg":"Connection ended","attr":{"remote":"10.240.1.237:41354","connectionId":730,"connectionCount":62}}
{"t":{"$date":"2021-01-13T11:43:14.630+00:00"},"s":"I",  "c":"NETWORK",  "id":22944,   "ctx":"conn729","msg":"Connection ended","attr":{"remote":"10.240.1.237:41352","connectionId":729,"connectionCount":61}}
 .
.