Hi Experts,
I have put together a dashboard in charts.mongodb.com and below is how it looks like now.
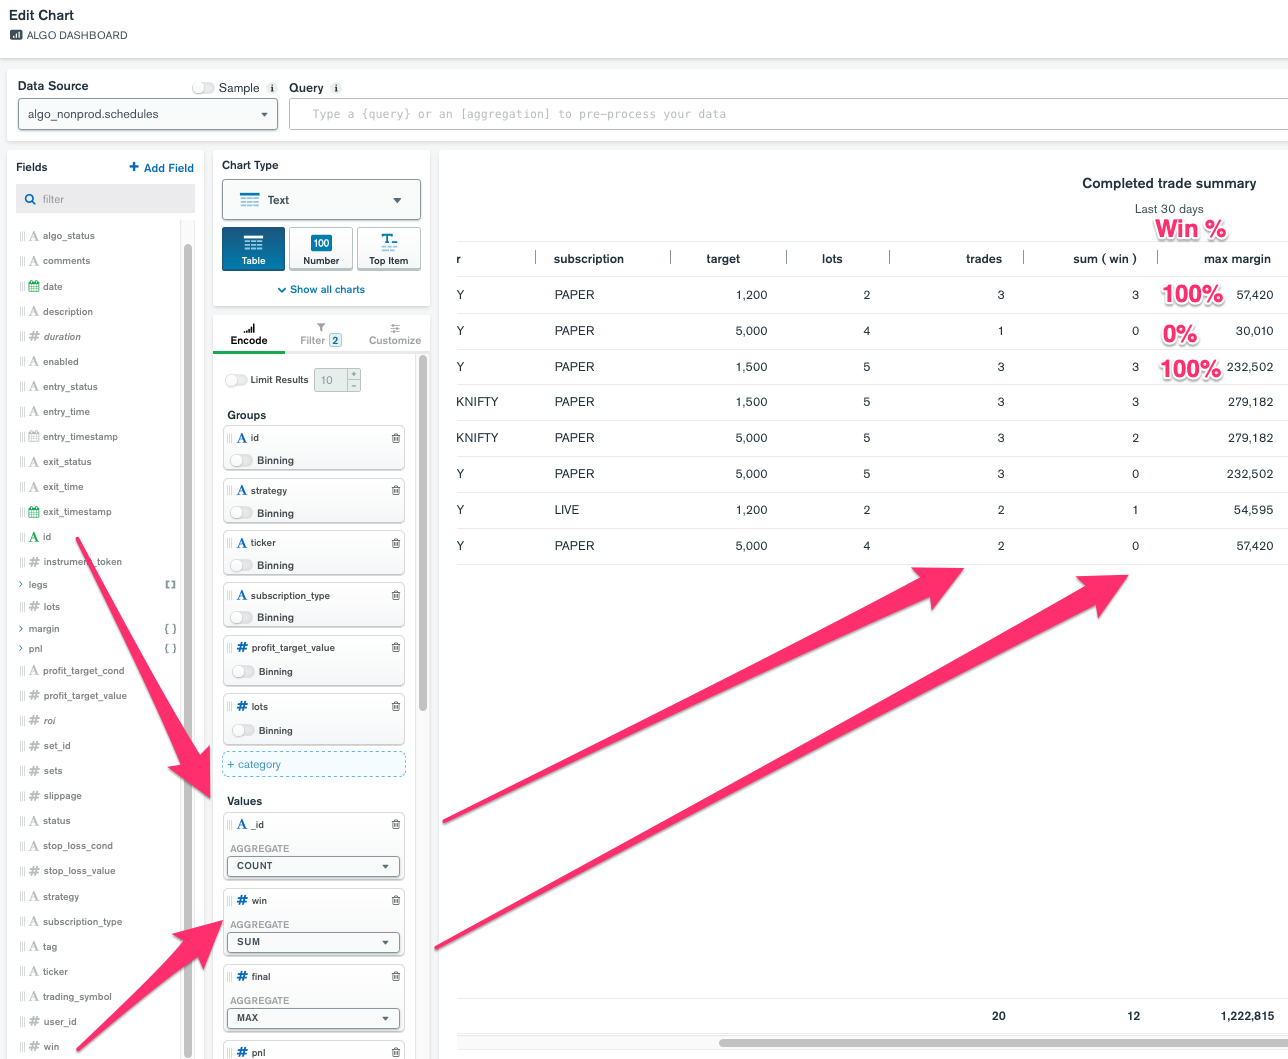
Now, I wanted to have a new column something like win % in the chart(as depicted in the screenshot above) by dividing the aggregated fields win & trades and struggling a bit to achieve that. can one of you throw some light on how I can do this ?
Thanks much for your time going through this query.
Hi @Rich_Bull_Club ,
You can press the “add field” button on the left upper and choose a calculated field with a division expression.
Having said that it can operate on the source data and not the sum of wins. So you will need to pre aggregate the data to have this as a field in the collection by applying a pipeline on the data source page.
If you still struggling let me know
Thanks
Pavel
Thank you @Pavel_Duchovny for the reply. Will give your suggestion a try and get back. Cheers!