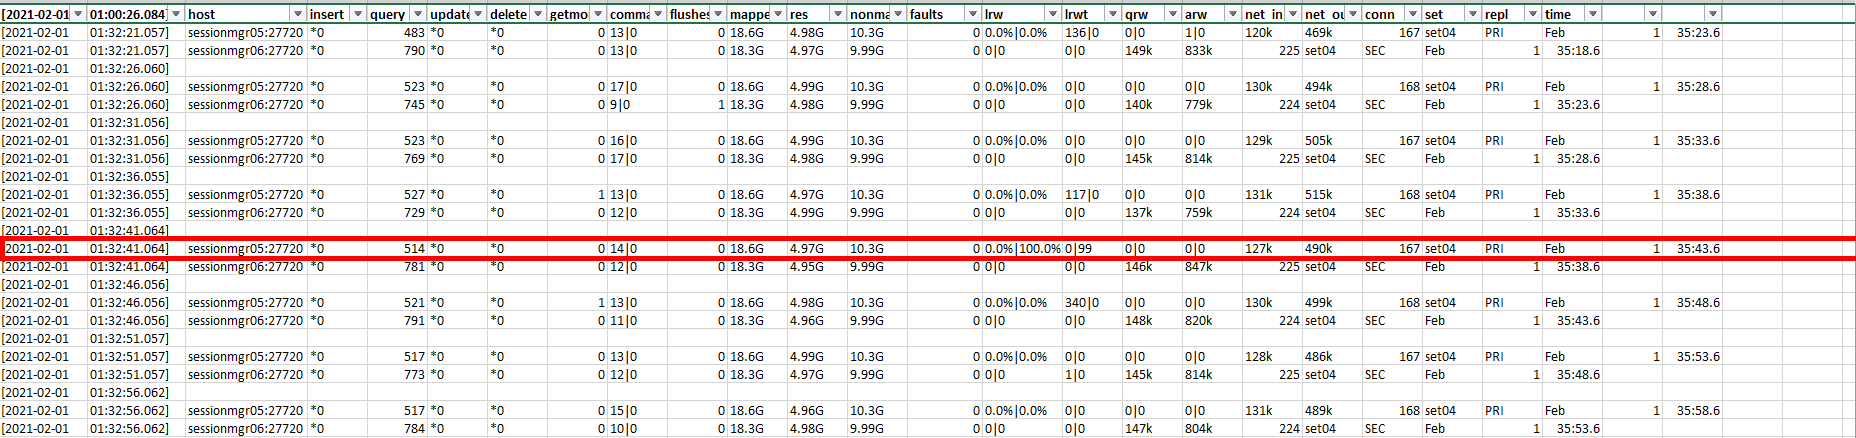
As per mongo documentation lrw column shows read|write lock percentage. Based on which data, this field is getting populated ? The mongotop output in the specified time window does not have any write operations. The db.currentOp() output also does not show any operation waiting for lock.So, in this context how does one explain the 100% the write lock column.
System Configuration
Os Version: CentOS 7
cat /etc/redhat-release
CentOS Linux release 7.6.1810 (Core)
Mongo Version : 3.4.16
Storage Engine: mmapV1
Data Path is on tmpfs
mongostat calculates its data from the serverStatus command. It uses the locks.Collection subdocument to calculate lrw and lrwt: serverStatus — MongoDB Manual
14 commands ran during that time period, it’s possible one of those acquired an exclusive lock. I’ll note that running db.currentOp() will only give you a snapshot of the current running operations. You might not catch the op that is acquiring a lock if you run db.currentOp(). Additonally, it looks like the time period of mongotop that you showed doesn’t match up with the time period from mongostat (1:32:06 vs 1:35:43)?
@Pavel_Duchovny these are MMAPv1 specific stats and won’t be shown unless running against a mongod that is using MMAPv1 and you use the --all option. @Kokila_Soumi by the way, MongoDB 3.4 is no longer supported and MMAPv1 is deprecated. We would strongly recommend that you upgrade to a newer version of MongoDB with WiredTiger.
As per this mongostat — MongoDB Manual link, the command column in the mongostat output indicates the commands run on the secondary, local|replicated. But the mongostat output is collected from the primary member. so i could not find any documentation on what is explanation for the data on primary member.
Is there any system configuration for the number of locks(similar to file decriptor) which is used to calculate lock percentage ?
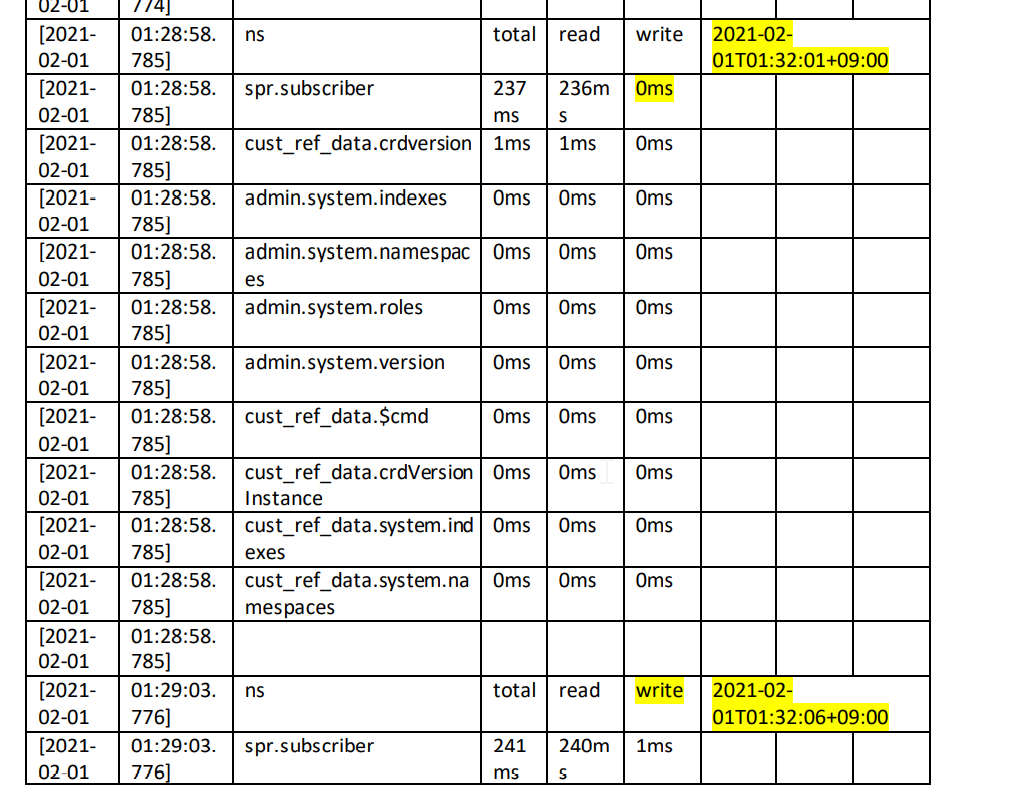
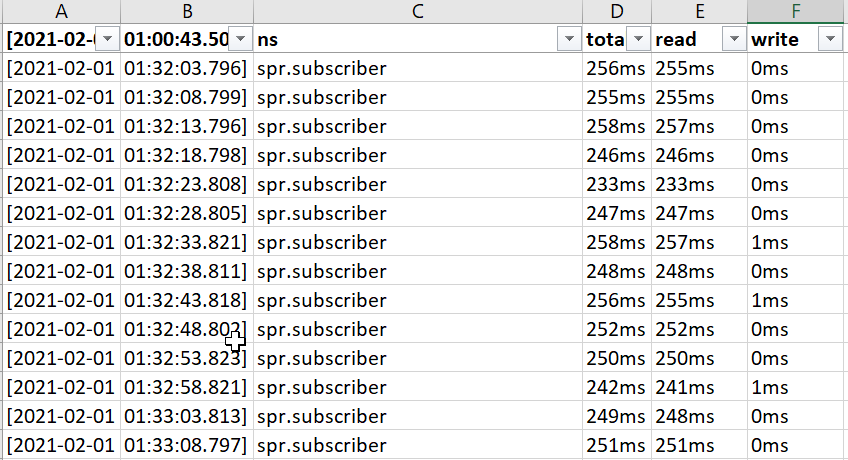
As mentioned earlier, in the row when lrw shows 100 %, the equivalent mongotop output before and after the time does not show any write operation. Please refer newly attached screenshot(mongotop)
3.1 Also, in same rows(of mongostat output) we could see only query operations count is greater than zero. If so, 14 commands will be for read operations. Will Exclusive Lock be acquired for Mongo Read operation and how it is affecting write lock percentage ?
If lrw is not dependable parameter to monitor the health of the mongo instance, what other parameter has to be monitored to ensure mongo instance is healthy(apart from Memory and CPU Utilization) ?
5.If not lrw, is there any mechanism to monitor the lock % on the system ?
That looks like a mistake in the documentation. mongostat shows local|replicated for both primary and secondary nodes. I will open an internal ticket to fix that. Sorry for the confusion.
The lock percentage is calculated as serverStatus.locks.W.acquireWaitCount / serverStatus.locks.W.acquireCount. This means that you could see 100% even if only 1 Write lock was acquired and it had to wait because of a conflicting lock. Therefore a value of 100% should not be alarming. It does not necessarily mean that there is high lock contention.
The mongostat output for 01:32:41 is showing what happened in the past 5 second interval (01:32:36 to 01:32:41). Mongotop is also showing what happened in the last 5 seconds, but it’s happening at a different 5-second interval. The mongotop interval 01:32:38 to 01:32:43 shows 1ms of write locks. That interval overlaps with the mongostat interval 01:32:36 to 01:32:41. So I think this all makes sense if a command acquired the write lock between 01:32:38 and 01:32:41.
Also you said:
we could see only query operations count is greater than zero. If so, 14 commands will be for read operations.
This is not correct, the command might not be an insert, update, or delete, but there are other commands that can take an exclusive lock that won’t show up in any of the other fields. For example the findAndModify command would take an exclusive lock but doesn’t show up under insert.
I don’t think lrw is a great parameter to use to monitor the health of a mongod. As I explained above, a high lrw value doesn’t necessarily indicate that there’s anything wrong.
There are dozens of other parameters you could monitor. Memory, CPU, and disk usage are probably the most useful things to monitor. If you want a more full monitoring solution, I would recommend either upgrading to a newer version so that you can use Free Cloud Monitoring, or using MongoDB Atlas which includes even more sophisticated monitoring.
I’m sorry, I’m not sure what you mean exactly by “lock % on the system”.
I will mention that locking is generally a much lower concern in WiredTiger than it is in MMAPv1. For most operations WiredTiger locks at the document level and uses optimistic concurrency control. So lock contention is less frequent. Again, I’d strongly recommend using a newer version of MongoDB with WiredTiger if you can. If you need some pointers on how to do that, let me know.