I’ve had my script running during the day so that i could monitor it. I’ve collected some further information.
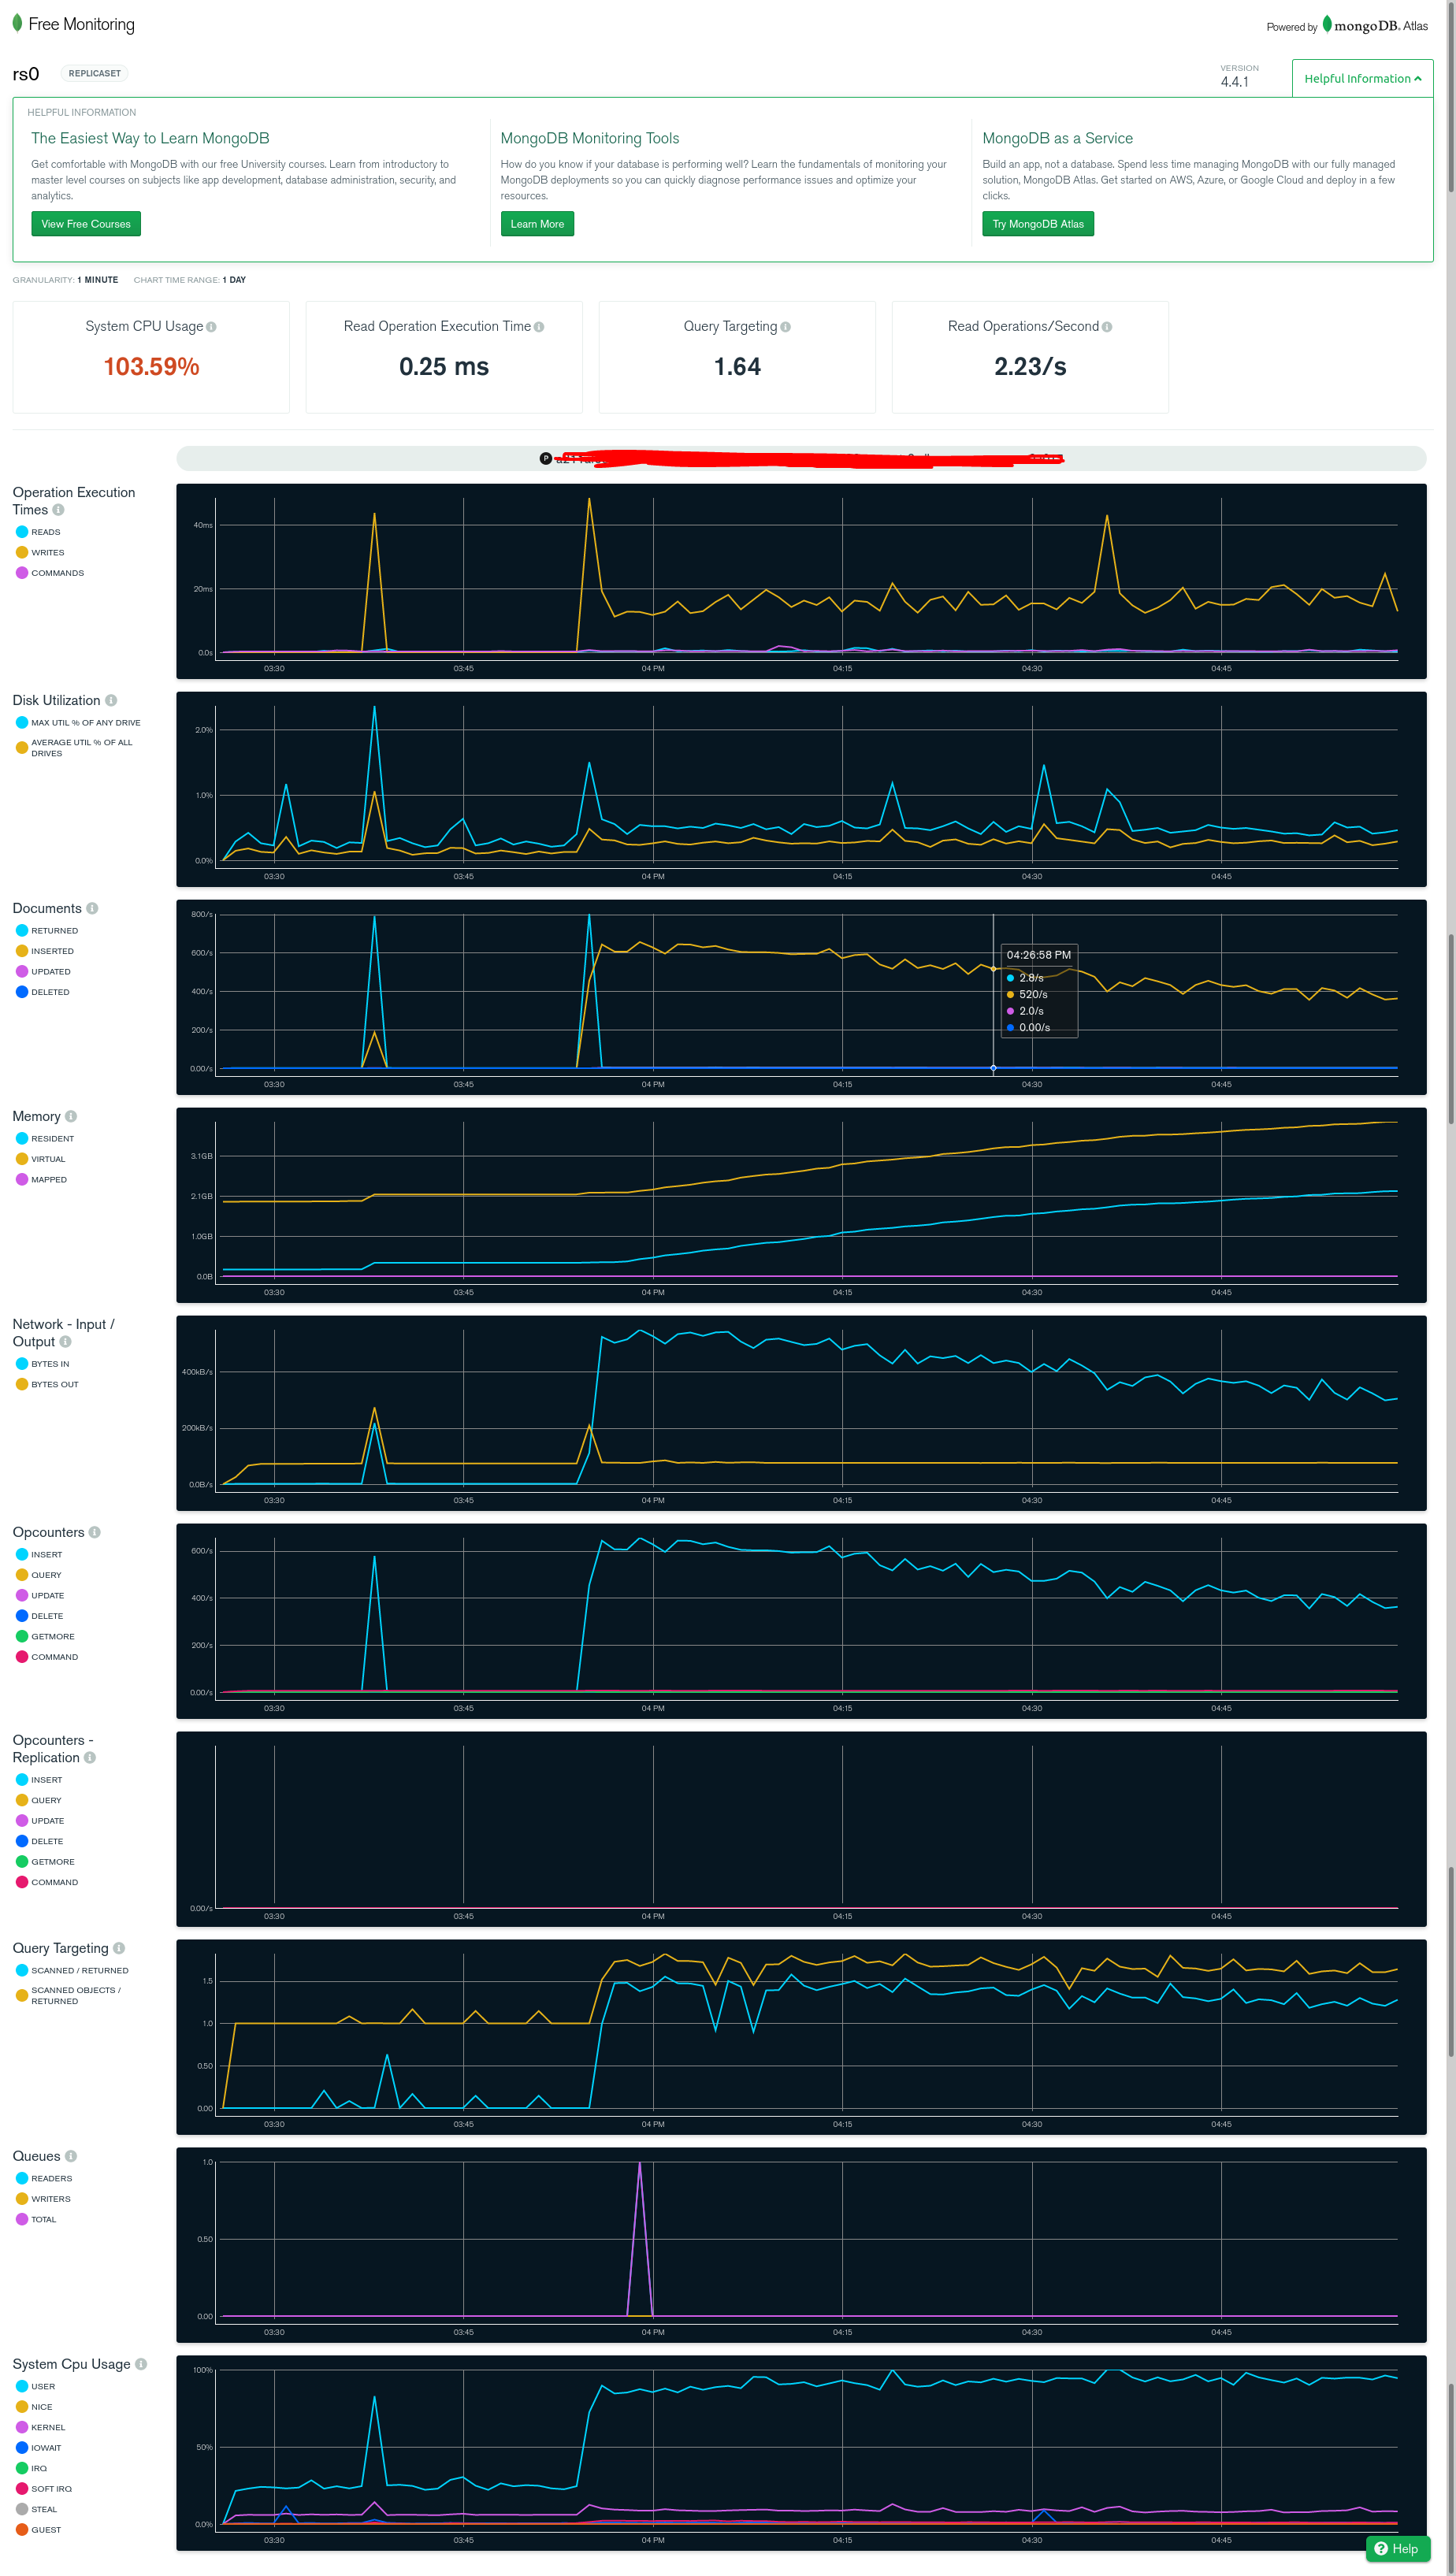
freemonitoring dashboard
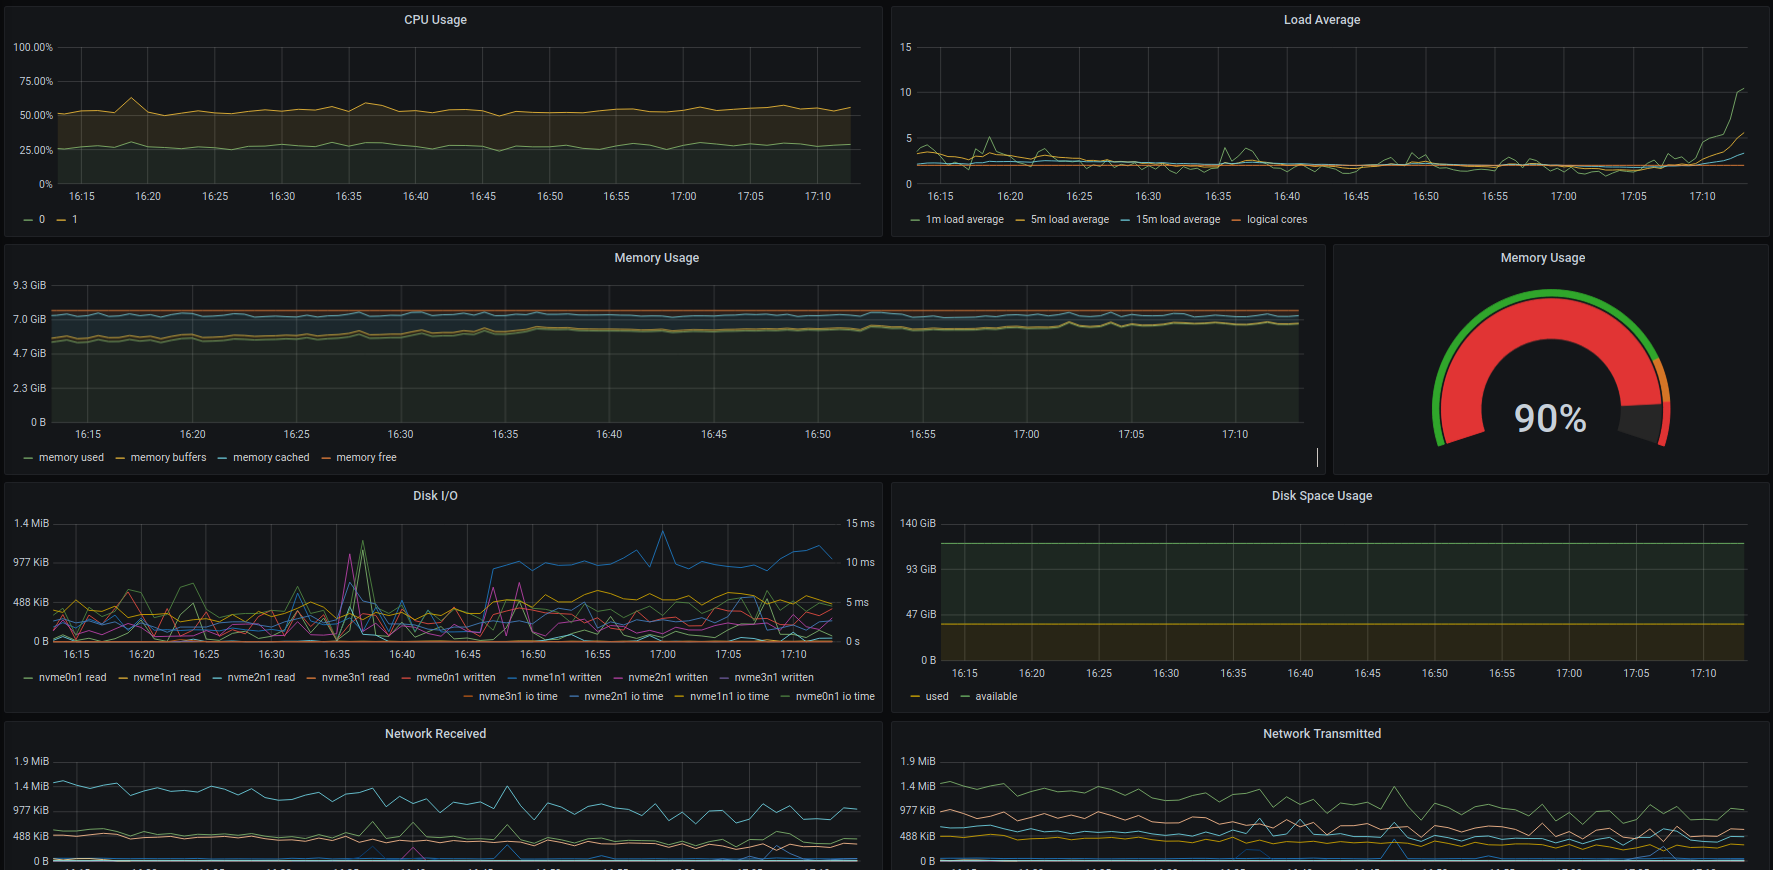
I can see from the freemonitoring dashboard that it says my cpu utilization is above 100%. I am quite confused by this because my grafana dashboard which pulls in metrics from Kubernetes does not say the same. My EC2 node on aws console shows 50-75% util.
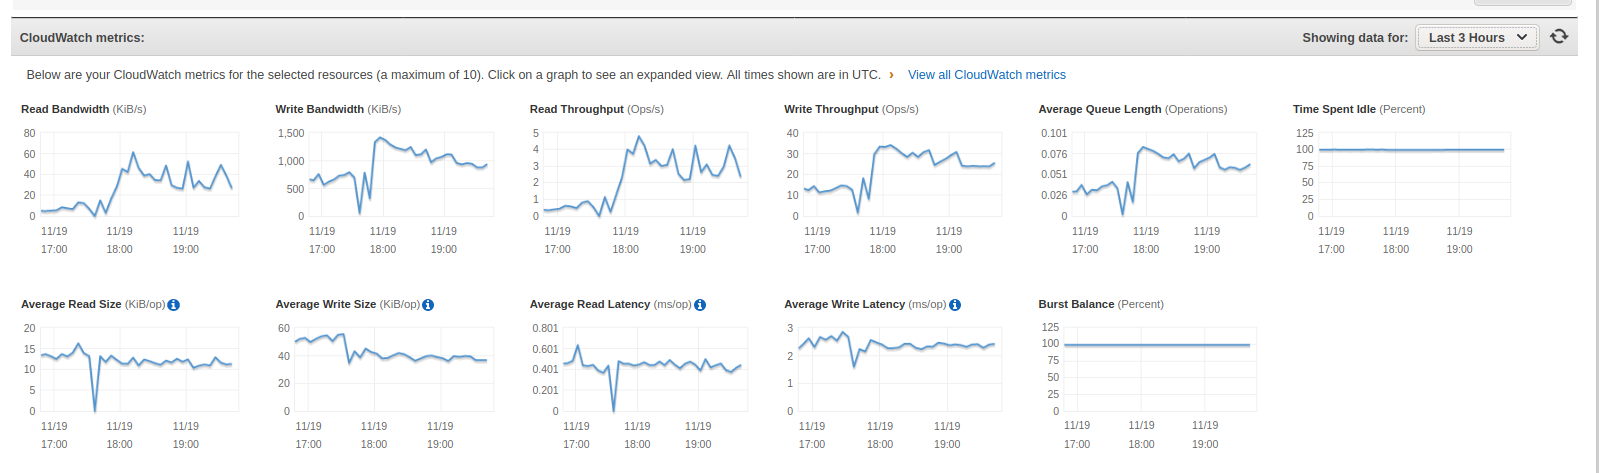
You mentioned it could be a storage IO performance. My mongodb in k8 is using a pvc which creates an aws ebs. I checked the metrics for the specific ebs and i see the following during the time the script was running.