Hi friends,
I have a mongodb replicaset setup using bitnami/helm charts/bitnami/mongodb at main · bitnami/charts · GitHub which lives on my k8 cluster.
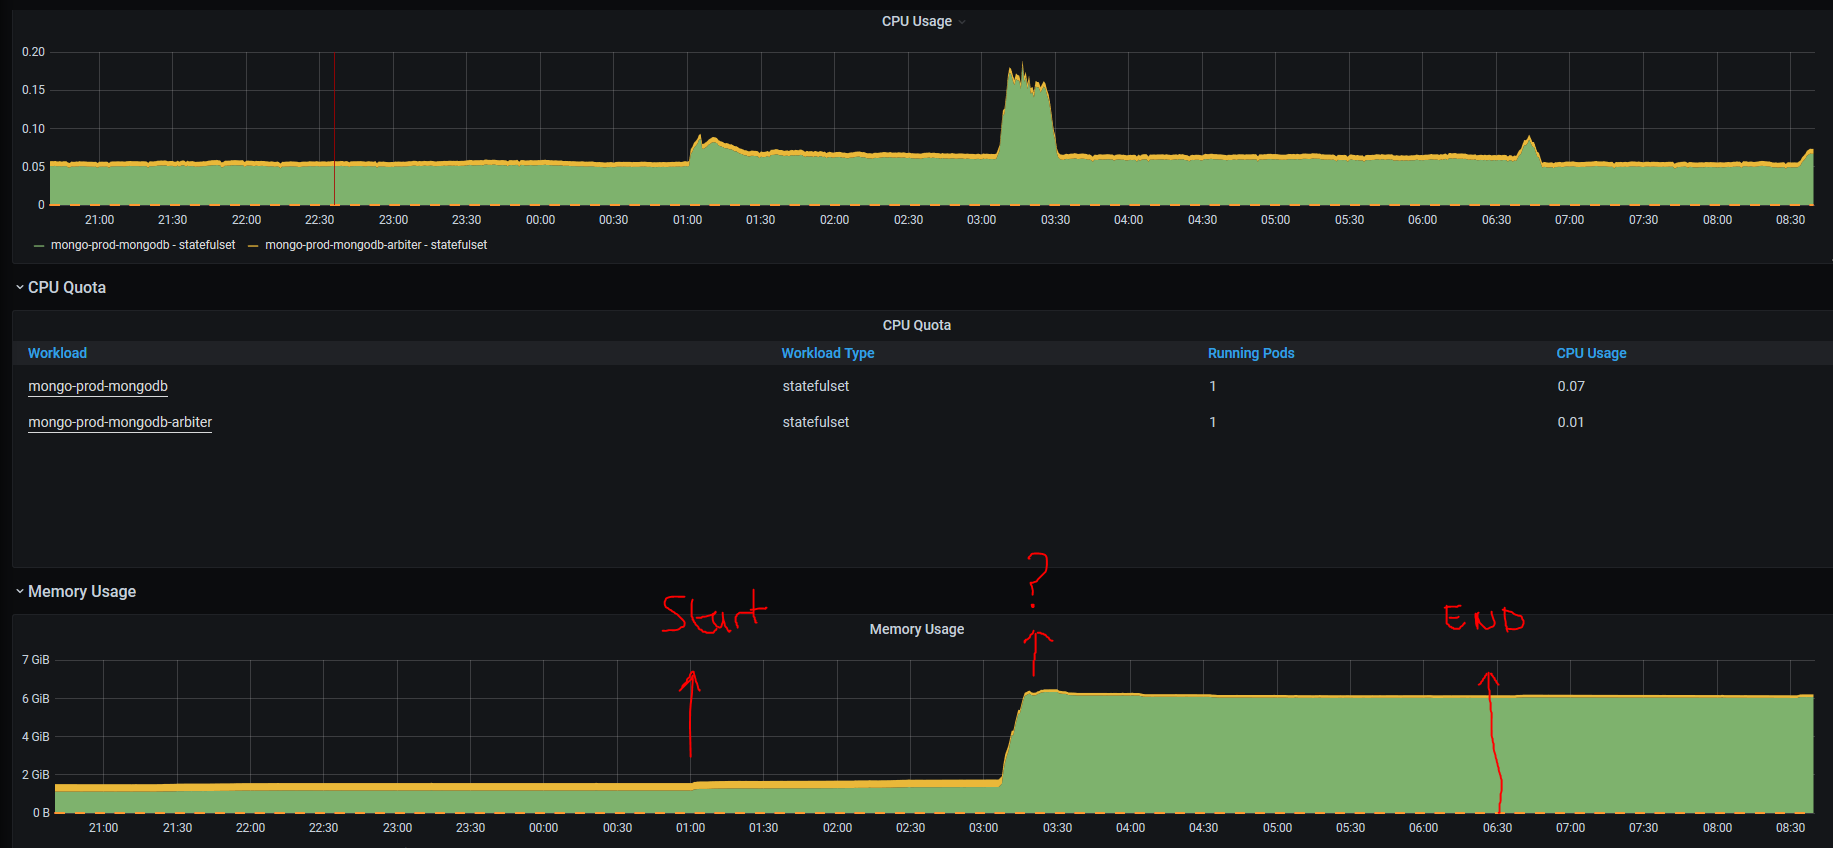
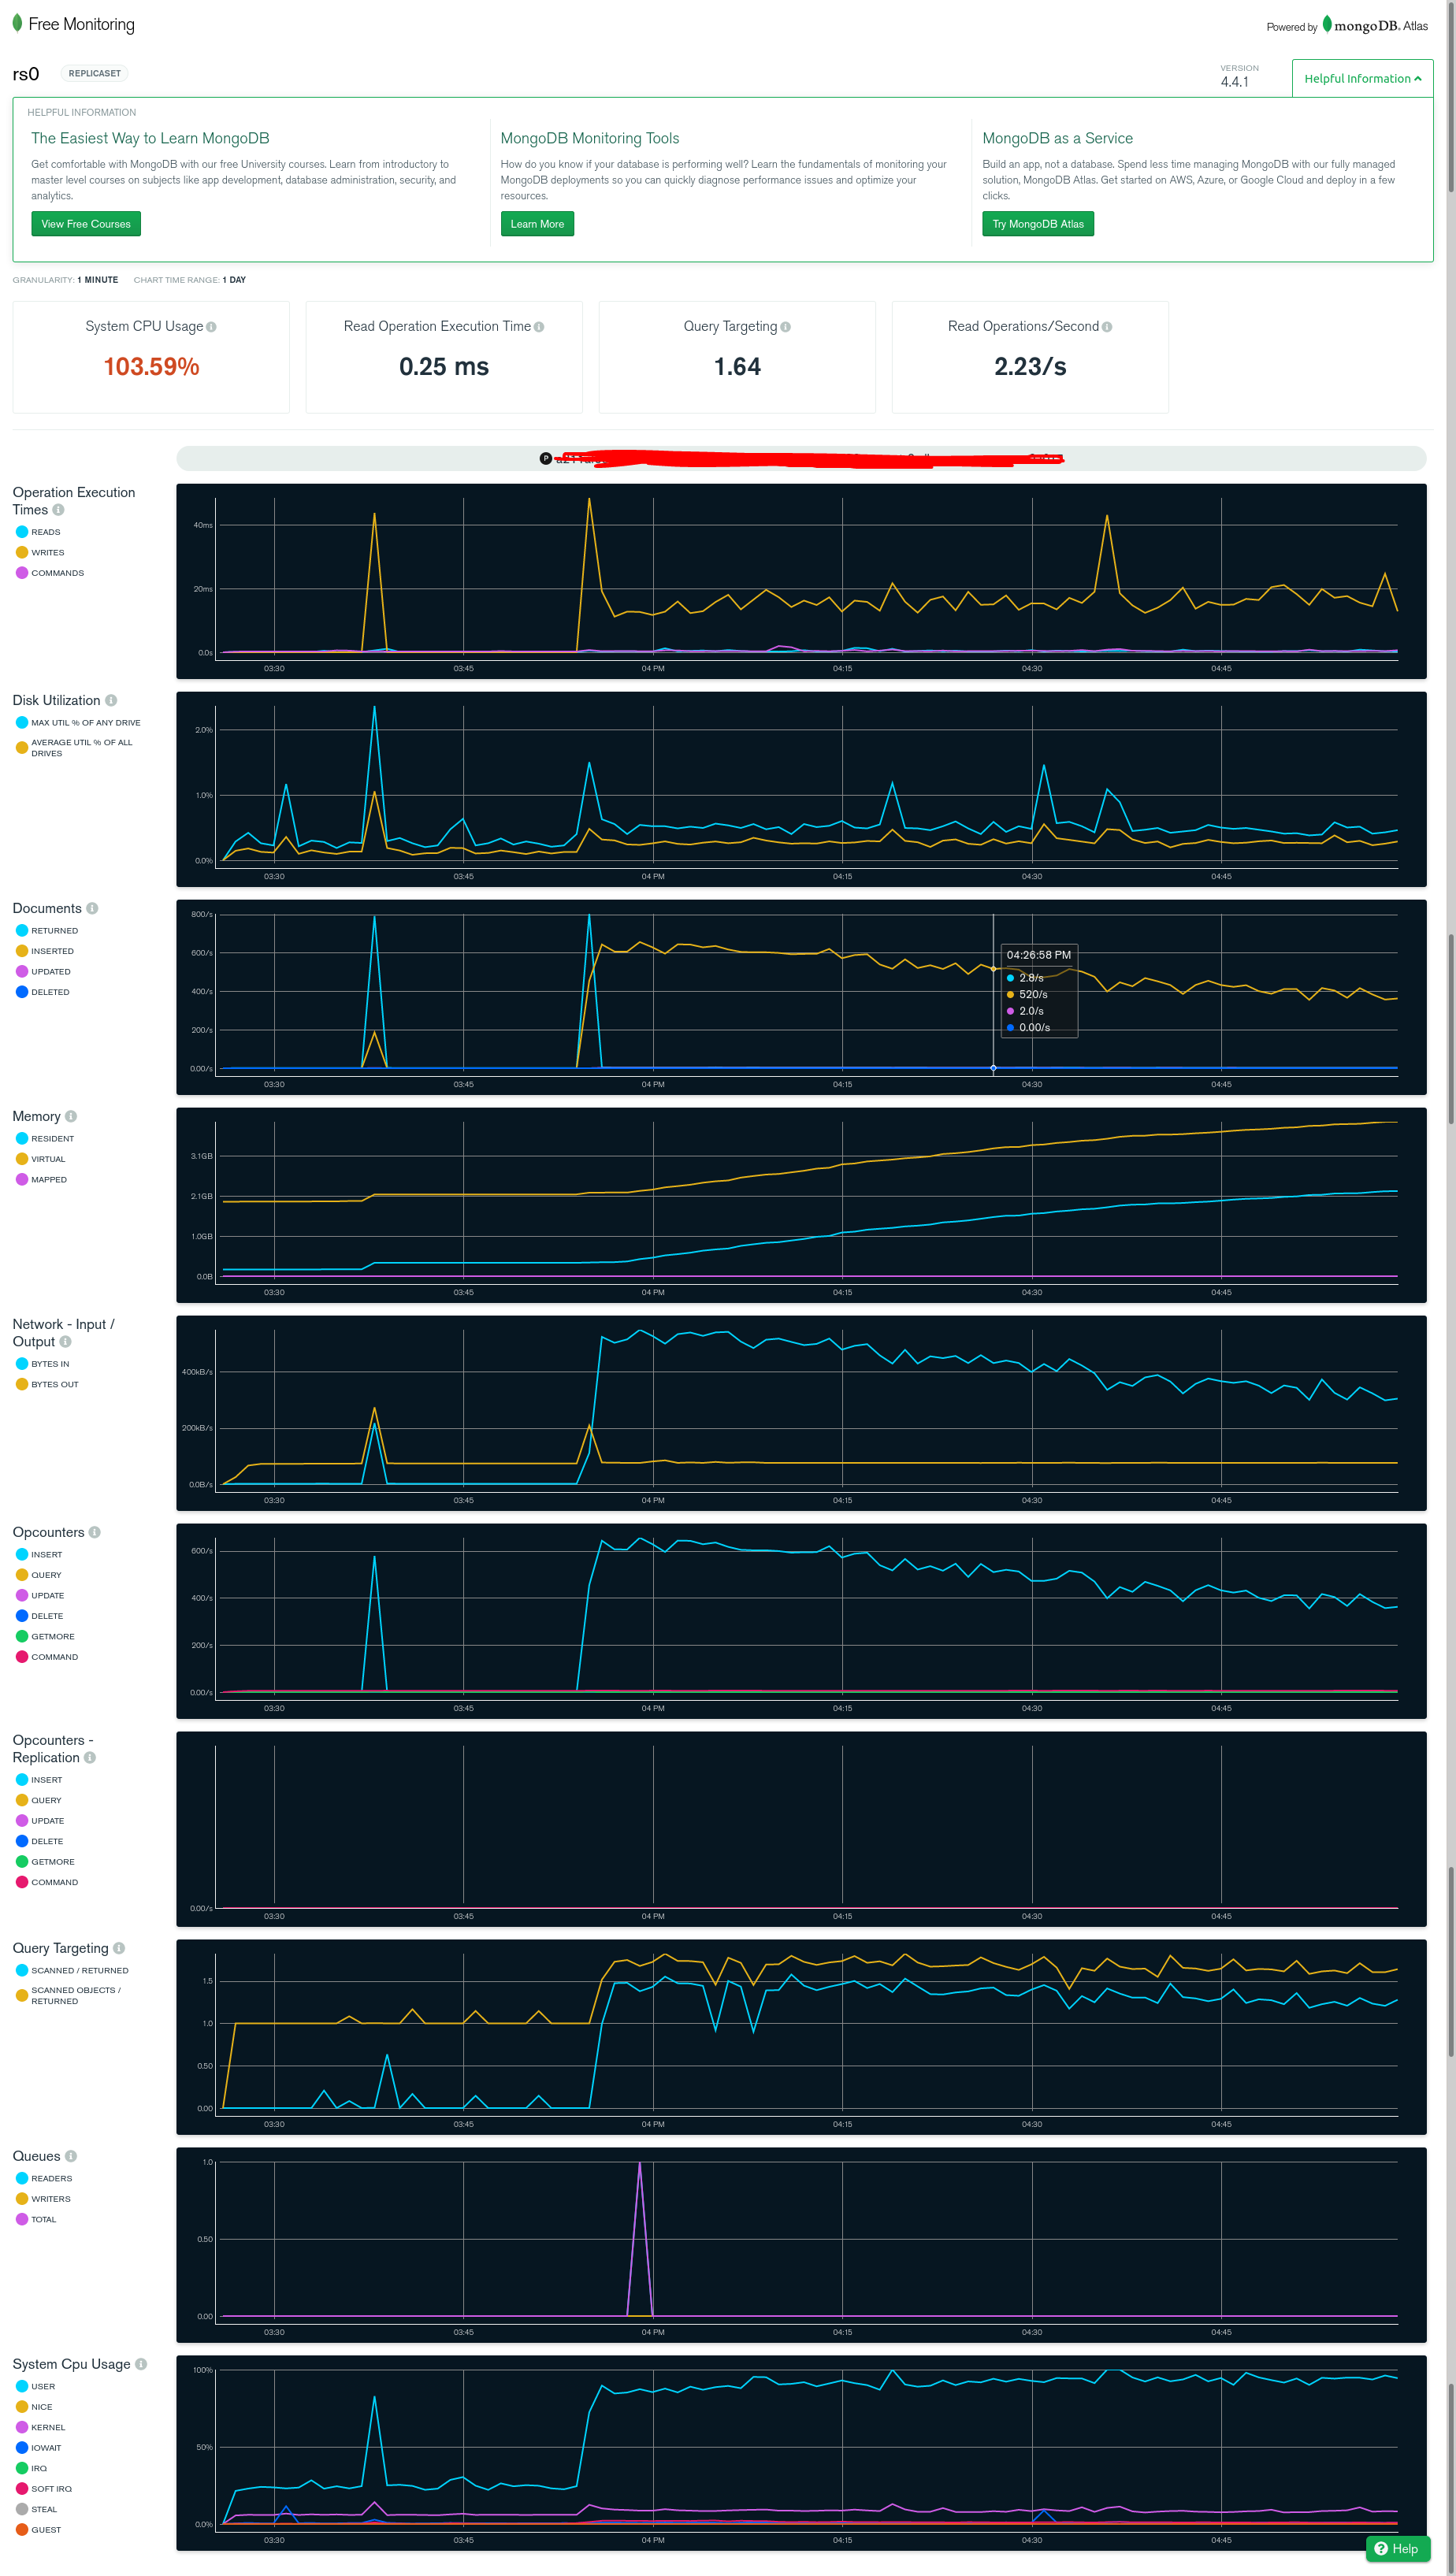
I have a cron job that runs every night to store data in a my mongo db. It failed lat night at around 1am-3am because mongo is no longer in a primary state.
MongoError: Not primary while writing
When i check the logs of the mongodb arbiter i can see the following logs around the same time.
kubectl logs -f mongo-prod-mongodb-arbiter-0
First i get a set of logs like this which tell me slow query or the server status was slow.
{"t":{"$date":"2020-11-17T03:19:19.376+00:00"},"s":"I",  "c":"COMMAND",  "id":51803,   "ctx":"conn3","msg":"Slow query","attr":{"type":"command","ns":"admin.$cmd","command":{"replSetHeartbeat":"rs0","configVersion":492521,"hbv":1,"from":"<redacted>6-<redacted>.us-east-2.elb.amazonaws.com:27017","fromId":0,"term":14,"$replData":1,"$clusterTime":{"clusterTime":{"$timestamp":{"t":1605583150,"i":1}},"signature":{"hash":{"$binary":{"base64":"GGP8UlQZ1+TrxWk2hronxraFYrU=","subType":"0"}},"keyId":6855964983600087045}},"$db":"admin"},"numYields":0,"reslen":489,"locks":{},"protocol":"op_msg","durationMillis":3476}}
{"t":{"$date":"2020-11-17T03:19:21.251+00:00"},"s":"I",  "c":"COMMAND",  "id":20499,   "ctx":"ftdc","msg":"serverStatus was very slow","attr":{"timeStats":{"after basic":1279,"after asserts":1287,"after connections":1288,"after electionMetrics":1690,"after extra_info":1690,"after flowControl":1690,"after globalLock":1690,"after locks":1691,"after logicalSessionRecordCache":1710,"after mirroredReads":1712,"after network":1712,"after opLatencies":1723,"after opReadConcernCounters":1723,"after opcounters":1723,"after opcountersRepl":1723,"after oplogTruncation":1756,"after repl":5239,"after security":5579,"after storageEngine":7089,"after tcmalloc":7089,"after trafficRecording":7089,"after transactions":7089,"after transportSecurity":7089,"after twoPhaseCommitCoordinator":7089,"after wiredTiger":7101,"at end":7118}}}
{"t":{"$date":"2020-11-17T03:19:23.436+00:00"},"s":"I",  "c":"COMMAND",  "id":20499,   "ctx":"ftdc","msg":"serverStatus was very slow","attr":{"timeStats":{"after basic":17,"after asserts":17,"after connections":17,"after electionMetrics":17,"after extra_info":17,"after flowControl":17,"after globalLock":17,"after locks":17,"after logicalSessionRecordCache":17,"after mirroredReads":17,"after network":338,"after opLatencies":354,"after opReadConcernCounters":398,"after opcounters":398,"after opcountersRepl":398,"after oplogTruncation":576,"after repl":697,"after security":707,"after storageEngine":810,"after tcmalloc":1015,"after trafficRecording":1028,"after transactions":1038,"after transportSecurity":1038,"after twoPhaseCommitCoordinator":1065,"after wiredTiger":1075,"at end":1113}}}
{"t":{"$date":"2020-11-17T03:19:26.085+00:00"},"s":"I",  "c":"COMMAND",  "id":51803,   "ctx":"conn3","msg":"Slow query","attr":{"type":"command","ns":"admin.$cmd","command":{"replSetHeartbeat":"rs0","configVersion":492521,"hbv":1,"from":"<redacted>6-<redacted>.us-east-2.elb.amazonaws.com:27017","fromId":0,"term":14,"$replData":1,"$clusterTime":{"clusterTime":{"$timestamp":{"t":1605583163,"i":2}},"signature":{"hash":{"$binary":{"base64":"r6eVme2iBLtlxWnwJyYhawoEin4=","subType":"0"}},"keyId":6855964983600087045}},"$db":"admin"},"numYields":0,"reslen":489,"locks":{},"protocol":"op_msg","durationMillis":149}}
Then eventually the member switches to secondary state
{"t":{"$date":"2020-11-17T03:22:18.507+00:00"},"s":"I",  "c":"NETWORK",  "id":51800,   "ctx":"conn7501","msg":"client metadata","attr":{"remote":"100.96.4.176:38788","client":"conn7501","doc":{"driver":{"name":"NetworkInterfaceTL","version":"4.4.1"},"os":{"type":"Linux","name":"PRETTY_NAME=\"Debian GNU/Linux 10 (buster)\"","architecture":"x86_64","version":"Kernel 4.9.0-11-amd64"}}}}
{"t":{"$date":"2020-11-17T03:22:18.508+00:00"},"s":"I",  "c":"ACCESS",   "id":20250,   "ctx":"conn7500","msg":"Successful authentication","attr":{"mechanism":"SCRAM-SHA-256","principalName":"__system","authenticationDatabase":"local","client":"100.96.4.176:38784"}}
{"t":{"$date":"2020-11-17T03:22:18.550+00:00"},"s":"I",  "c":"ACCESS",   "id":20250,   "ctx":"conn7501","msg":"Successful authentication","attr":{"mechanism":"SCRAM-SHA-256","principalName":"__system","authenticationDatabase":"local","client":"100.96.4.176:38788"}}
{"t":{"$date":"2020-11-17T03:22:20.175+00:00"},"s":"I",  "c":"REPL",     "id":21215,   "ctx":"ReplCoord-40","msg":"Member is in new state","attr":{"hostAndPort":"<redacted>-<redacted>.us-east-2.elb.amazonaws.com:27017","newState":"SECONDARY"}}
Not always but this time it seemed to have recovered and gone back into primary state
{"t":{"$date":"2020-11-17T03:22:28.913+00:00"},"s":"I",  "c":"ELECTION", "id":23980,   "ctx":"conn7499","msg":"Responding to vote request","attr":{"request":"{ replSetRequestVotes: 1, setName: \"rs0\", dryRun: true, term: 14, candidateIndex: 0, configVersion: 492521, configTerm: -1, lastCommittedOp: { ts: Timestamp(1605583310, 7), t: 14 } }","response":"{ term: 14, voteGranted: true, reason: \"\" }","replicaSetStatus":"Current replSetGetStatus output: { set: \"rs0\", date: new Date(1605583348912), myState: 7, term: 14, syncSourceHost: \"\", syncSourceId: -1, heartbeatIntervalMillis: 2000, majorityVoteCount: 2, writeMajorityCount: 1, votingMembersCount: 2, writableVotingMembersCount: 1, optimes: { lastCommittedOpTime: { ts: Timestamp(1605583310, 7), t: 14 }, lastCommittedWallTime: new Date(1605583310813), appliedOpTime: { ts: Timestamp(1605583310, 7), t: 14 }, durableOpTime: { ts: Timestamp(0, 0), t: -1 }, lastAppliedWallTime: new Date(1605583310813), lastDurableWallTime: new Date(0) }, members: [ { _id: 0, name: \"<redacted>-<redacted>.us-east-2.elb.amazonaws.com:27017\", health: 1.0, state: 2, stateStr: \"SECONDARY\", uptime: 37487, optime: { ts: Timestamp(1605583310, 7), t: 14 }, optimeDurable: { ts: Timestamp(1605583310, 7), t: 14 }, optimeDate: new Date(1605583310000), optimeDurableDate: new Date(1605583310000), lastHeartbeat: new Date(1605583348185), lastHeartbeatRecv: new Date(1605583348696), pingMs: 277, lastHeartbeatMessage: \"\", syncSourceHost: \"\", syncSourceId: -1, infoMessage: \"\", configVersion: 492521, configTerm: -1 }, { _id: 1, name: \"mongo-prod-mongodb-arbiter-0.mongo-prod-mongodb-arbiter-headless.mongodb.svc.cluster.local:27017\", health: 1.0, state: 7, stateStr: \"ARBITER\", uptime: 0, syncSourceHost: \"\", syncSourceId: -1, infoMessage: \"\", configVersion: 492521, configTerm: -1, self: true, lastHeartbeatMessage: \"\" } ] }"}}
{"t":{"$date":"2020-11-17T03:22:28.918+00:00"},"s":"I",  "c":"ELECTION", "id":23980,   "ctx":"conn7499","msg":"Responding to vote request","attr":{"request":"{ replSetRequestVotes: 1, setName: \"rs0\", dryRun: false, term: 15, candidateIndex: 0, configVersion: 492521, configTerm: -1, lastCommittedOp: { ts: Timestamp(1605583310, 7), t: 14 } }","response":"{ term: 15, voteGranted: true, reason: \"\" }","replicaSetStatus":"Current replSetGetStatus output: { set: \"rs0\", date: new Date(1605583348918), myState: 7, term: 15, syncSourceHost: \"\", syncSourceId: -1, heartbeatIntervalMillis: 2000, majorityVoteCount: 2, writeMajorityCount: 1, votingMembersCount: 2, writableVotingMembersCount: 1, optimes: { lastCommittedOpTime: { ts: Timestamp(1605583310, 7), t: 14 }, lastCommittedWallTime: new Date(1605583310813), appliedOpTime: { ts: Timestamp(1605583310, 7), t: 14 }, durableOpTime: { ts: Timestamp(0, 0), t: -1 }, lastAppliedWallTime: new Date(1605583310813), lastDurableWallTime: new Date(0) }, members: [ { _id: 0, name: \"<redacted>-<redacted>.us-east-2.elb.amazonaws.com:27017\", health: 1.0, state: 2, stateStr: \"SECONDARY\", uptime: 37487, optime: { ts: Timestamp(1605583310, 7), t: 14 }, optimeDurable: { ts: Timestamp(1605583310, 7), t: 14 }, optimeDate: new Date(1605583310000), optimeDurableDate: new Date(1605583310000), lastHeartbeat: new Date(1605583348185), lastHeartbeatRecv: new Date(1605583348696), pingMs: 277, lastHeartbeatMessage: \"\", syncSourceHost: \"\", syncSourceId: -1, infoMessage: \"\", configVersion: 492521, configTerm: -1 }, { _id: 1, name: \"mongo-prod-mongodb-arbiter-0.mongo-prod-mongodb-arbiter-headless.mongodb.svc.cluster.local:27017\", health: 1.0, state: 7, stateStr: \"ARBITER\", uptime: 0, syncSourceHost: \"\", syncSourceId: -1, infoMessage: \"\", configVersion: 492521, configTerm: -1, self: true, lastHeartbeatMessage: \"\" } ] }"}}
{"t":{"$date":"2020-11-17T03:22:30.187+00:00"},"s":"I",  "c":"REPL",     "id":21215,   "ctx":"ReplCoord-40","msg":"Member is in new state","attr":{"hostAndPort":"<redacted>-<redacted>.us-east-2.elb.amazonaws.com:27017","newState":"PRIMARY"}}

{"t":{"$date":"2020-11-17T03:23:29.463+00:00"},"s":"I",  "c":"REPL",     "id":21216,   "ctx":"ReplCoord-40","msg":"Member is now in state RS_DOWN","attr":{"hostAndPort":"<redacted>-<redacted>.us-east-2.elb.amazonaws.com:27017","heartbeatMessage":"Request 18699 timed out, deadline was 2020-11-17T03:23:13.293+00:00, op was RemoteCommand 18699 -- target:[<redacted>-<redacted>.us-east-2.elb.amazonaws.com:27017] db:admin expDate:2020-11-17T03:23:13.285+00:00 cmd:{ replSetHeartbeat: \"rs0\", configVersion: 492521, hbv: 1, from: \"mongo-prod-mongodb-arbiter-0.mongo-prod-mongodb-arbiter-headless.mongodb.svc.cluster.local:27017\", fromId: 1, term: 15 }"}}
rs.status()
rs0:PRIMARY> rs.status()
{
	"set" : "rs0",
	"date" : ISODate("2020-11-17T08:53:33.966Z"),
	"myState" : 1,
	"term" : NumberLong(16),
	"syncSourceHost" : "",
	"syncSourceId" : -1,
	"heartbeatIntervalMillis" : NumberLong(2000),
	"majorityVoteCount" : 2,
	"writeMajorityCount" : 1,
	"votingMembersCount" : 2,
	"writableVotingMembersCount" : 1,
	"optimes" : {
		"lastCommittedOpTime" : {
			"ts" : Timestamp(1605603211, 1),
			"t" : NumberLong(16)
		},
		"lastCommittedWallTime" : ISODate("2020-11-17T08:53:31.190Z"),
		"readConcernMajorityOpTime" : {
			"ts" : Timestamp(1605603211, 1),
			"t" : NumberLong(16)
		},
		"readConcernMajorityWallTime" : ISODate("2020-11-17T08:53:31.190Z"),
		"appliedOpTime" : {
			"ts" : Timestamp(1605603211, 1),
			"t" : NumberLong(16)
		},
		"durableOpTime" : {
			"ts" : Timestamp(1605603211, 1),
			"t" : NumberLong(16)
		},
		"lastAppliedWallTime" : ISODate("2020-11-17T08:53:31.190Z"),
		"lastDurableWallTime" : ISODate("2020-11-17T08:53:31.190Z")
	},
	"lastStableRecoveryTimestamp" : Timestamp(1605603191, 1),
	"electionCandidateMetrics" : {
		"lastElectionReason" : "electionTimeout",
		"lastElectionDate" : ISODate("2020-11-17T03:24:18.778Z"),
		"electionTerm" : NumberLong(16),
		"lastCommittedOpTimeAtElection" : {
			"ts" : Timestamp(1605583378, 1),
			"t" : NumberLong(15)
		},
		"lastSeenOpTimeAtElection" : {
			"ts" : Timestamp(1605583393, 1),
			"t" : NumberLong(15)
		},
		"numVotesNeeded" : 2,
		"priorityAtElection" : 5,
		"electionTimeoutMillis" : NumberLong(10000),
		"numCatchUpOps" : NumberLong(0),
		"newTermStartDate" : ISODate("2020-11-17T03:24:18.784Z"),
		"wMajorityWriteAvailabilityDate" : ISODate("2020-11-17T03:24:18.868Z")
	},
	"members" : [
		{
			"_id" : 0,
			"name" : "<redacted>-<redacted>.us-east-2.elb.amazonaws.com:27017",
			"health" : 1,
			"state" : 1,
			"stateStr" : "PRIMARY",
			"uptime" : 57390,
			"optime" : {
				"ts" : Timestamp(1605603211, 1),
				"t" : NumberLong(16)
			},
			"optimeDate" : ISODate("2020-11-17T08:53:31Z"),
			"syncSourceHost" : "",
			"syncSourceId" : -1,
			"infoMessage" : "",
			"electionTime" : Timestamp(1605583458, 1),
			"electionDate" : ISODate("2020-11-17T03:24:18Z"),
			"configVersion" : 492521,
			"configTerm" : -1,
			"self" : true,
			"lastHeartbeatMessage" : ""
		},
		{
			"_id" : 1,
			"name" : "mongo-prod-mongodb-arbiter-0.mongo-prod-mongodb-arbiter-headless.mongodb.svc.cluster.local:27017",
			"health" : 1,
			"state" : 7,
			"stateStr" : "ARBITER",
			"uptime" : 19766,
			"lastHeartbeat" : ISODate("2020-11-17T08:53:33.072Z"),
			"lastHeartbeatRecv" : ISODate("2020-11-17T08:53:33.078Z"),
			"pingMs" : NumberLong(0),
			"lastHeartbeatMessage" : "",
			"syncSourceHost" : "",
			"syncSourceId" : -1,
			"infoMessage" : "",
			"configVersion" : 492521,
			"configTerm" : -1
		}
	],
	"ok" : 1,
	"$clusterTime" : {
		"clusterTime" : Timestamp(1605603211, 1),
		"signature" : {
			"hash" : BinData(0,"nSv0QPiJ+uvO9A8ljcDIpICTHqg="),
			"keyId" : NumberLong("6855964983600087045")
		}
	},
	"operationTime" : Timestamp(1605603211, 1)
}
Can someone help me understand what is happening here and what i can do to fix it.
fyi: Ive posted this question on stackoverflow why is mongodb switching from primary state to secondary - Stack Overflow where a user mentioned it may have something to do with Locking Performance
My script is making a request to an API and inserting the data received into a MongoDB. It does 10 data requests at a time concurrently. A single request may insert anywhere between 0-1500 documents into mongo.