We’re trying to optimise our read performance on our MongoDB cluster. We serve a social media like application where users are member of 1 or multiple groups.
We were storing who is in which group and whether he/she is an admin of that group in a separate collection. However we noticed it was quite slow to retrieve the group information for the groups the user is member of. (find(+filter) groupMember documents, populate the groups).
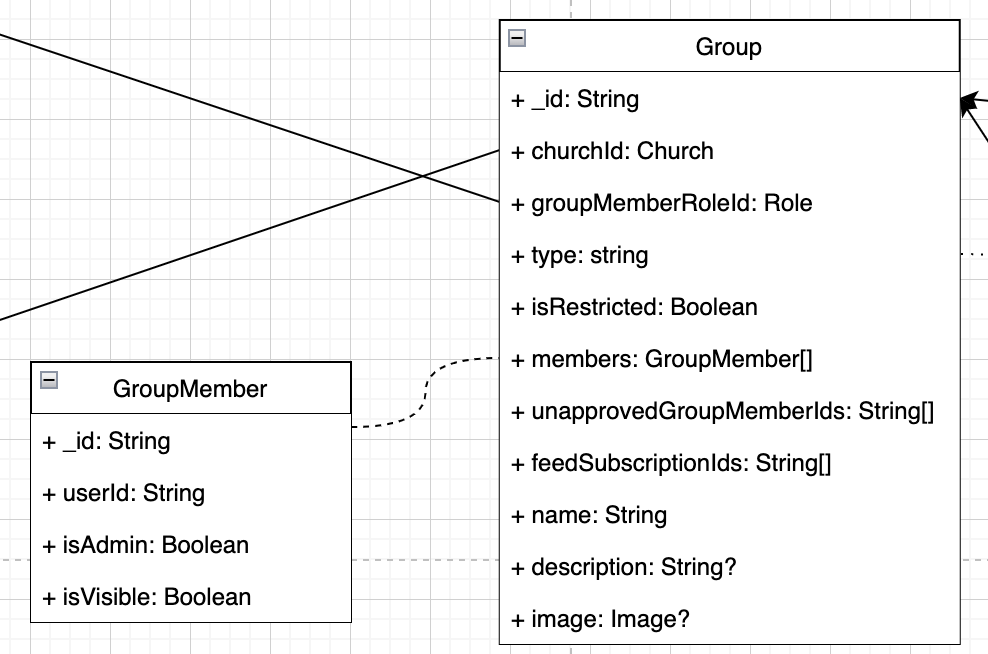
Therefor we recently migrated all the group members to an array on the group collection documents itself.
The schema now looks as following:
The query we execute is simply:
this.model.find({
 members: {
   $elemMatch: {
     userId: new ObjectId(userId),
   },
 },
})
We expected this to be much more performed because you don’t need to populate/lookup anything. The opposite is true however, after deploying this change we noticed a performance decrease.
We have around 40k group documents where the largest groups have around 3k members, most groups are much smaller however.
The groups are indexed and the index is also used. This is an explain plan:
{
  "explainVersion": "1",
  "queryPlanner": {
    "namespace": "***.groups",
    "indexFilterSet": false,
    "parsedQuery": {
      "members": {
        "$elemMatch": {
          "userId": {
            "$eq": "61b091ee9b50220e75208eb6"
          }
        }
      }
    },
    "queryHash": "DCF50157",
    "planCacheKey": "DCF50157",
    "maxIndexedOrSolutionsReached": false,
    "maxIndexedAndSolutionsReached": false,
    "maxScansToExplodeReached": false,
    "winningPlan": {
      "stage": "FETCH",
      "filter": {
        "members": {
          "$elemMatch": {
            "userId": {
              "$eq": "61b091ee9b50220e75208eb6"
            }
          }
        }
      },
      "inputStage": {
        "stage": "IXSCAN",
        "keyPattern": {
          "members.userId": 1
        },
        "indexName": "members.userId_1",
        "isMultiKey": true,
        "multiKeyPaths": {
          "members.userId": [
            "members"
          ]
        },
        "isUnique": false,
        "isSparse": false,
        "isPartial": false,
        "indexVersion": 2,
        "direction": "forward",
        "indexBounds": {
          "members.userId": [
            "[ObjectId('61b091ee9b50220e75208eb6'), ObjectId('61b091ee9b50220e75208eb6')]"
          ]
        }
      }
    },
    "rejectedPlans": []
  },
  "executionStats": {
    "executionSuccess": true,
    "nReturned": 17,
    "executionTimeMillis": 0,
    "totalKeysExamined": 17,
    "totalDocsExamined": 17,
    "executionStages": {
      "stage": "FETCH",
      "filter": {
        "members": {
          "$elemMatch": {
            "userId": {
              "$eq": "61b091ee9b50220e75208eb6"
            }
          }
        }
      },
      "nReturned": 17,
      "executionTimeMillisEstimate": 0,
      "works": 18,
      "advanced": 17,
      "needTime": 0,
      "needYield": 0,
      "saveState": 0,
      "restoreState": 0,
      "isEOF": 1,
      "docsExamined": 17,
      "alreadyHasObj": 0,
      "inputStage": {
        "stage": "IXSCAN",
        "nReturned": 17,
        "executionTimeMillisEstimate": 0,
        "works": 18,
        "advanced": 17,
        "needTime": 0,
        "needYield": 0,
        "saveState": 0,
        "restoreState": 0,
        "isEOF": 1,
        "keyPattern": {
          "members.userId": 1
        },
        "indexName": "members.userId_1",
        "isMultiKey": true,
        "multiKeyPaths": {
          "members.userId": [
            "members"
          ]
        },
        "isUnique": false,
        "isSparse": false,
        "isPartial": false,
        "indexVersion": 2,
        "direction": "forward",
        "indexBounds": {
          "members.userId": [
            "[ObjectId('61b091ee9b50220e75208eb6'), ObjectId('61b091ee9b50220e75208eb6')]"
          ]
        },
        "keysExamined": 17,
        "seeks": 1,
        "dupsTested": 17,
        "dupsDropped": 0
      }
    },
    "allPlansExecution": []
  },
  "command": {
    "find": "groups",
    "filter": {
      "members": {
        "$elemMatch": {
          "userId": "61b091ee9b50220e75208eb6"
        }
      }
    },
    "projection": {},
    "readConcern": {
      "level": "majority"
    },
    "$db": "***"
  },
  "serverInfo": {
    "host": "***",
    "port": 27017,
    "version": "6.0.3",
    "gitVersion": "f803681c3ae19817d31958965850193de067c516"
  },
  "serverParameters": {
    "internalQueryFacetBufferSizeBytes": 104857600,
    "internalQueryFacetMaxOutputDocSizeBytes": 104857600,
    "internalLookupStageIntermediateDocumentMaxSizeBytes": 104857600,
    "internalDocumentSourceGroupMaxMemoryBytes": 104857600,
    "internalQueryMaxBlockingSortMemoryUsageBytes": 104857600,
    "internalQueryProhibitBlockingMergeOnMongoS": 0,
    "internalQueryMaxAddToSetBytes": 104857600,
    "internalDocumentSourceSetWindowFieldsMaxMemoryBytes": 104857600
  },
  "ok": 1,
  "operationTime": {
    "$timestamp": "7168789227251957761"
  }
}
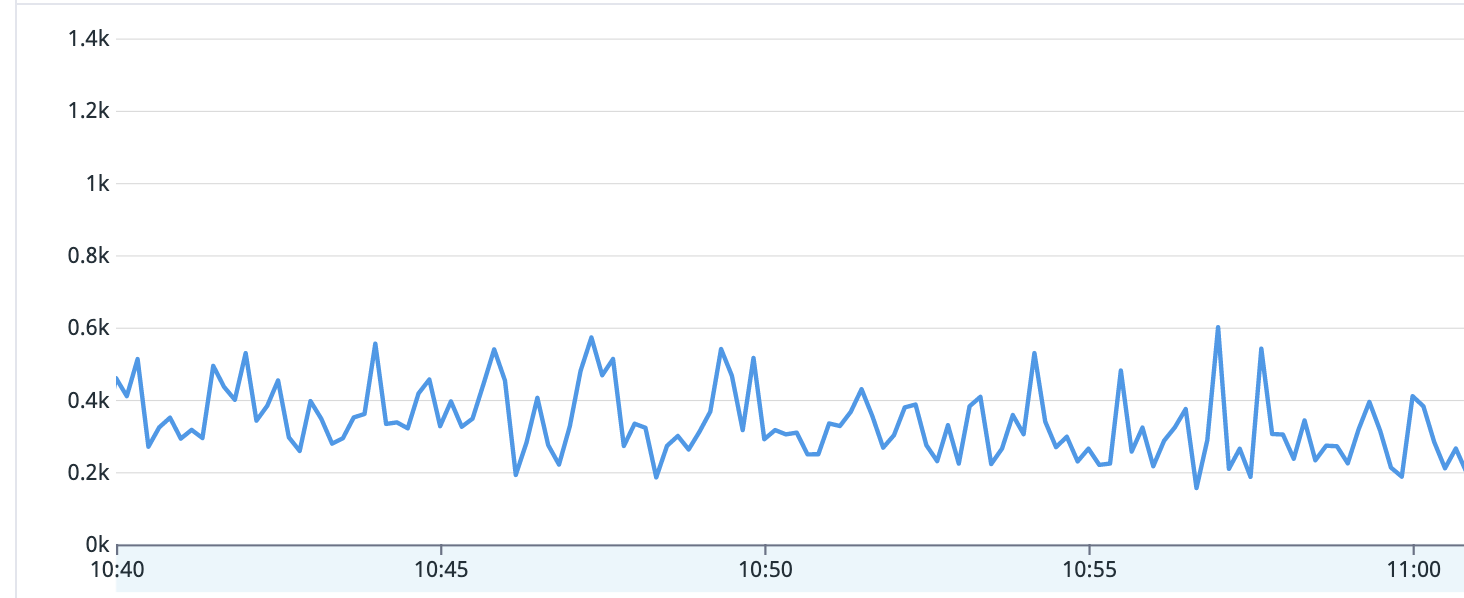
Under load the query takes 300-400ms, which is not acceptable for us.
However right now we don’t really know anymore what would be the best next step in improving the solution. Mongo does not advise any additional indexes or schema improvements at this moment.
What can we do best to get this query really performand?